What is the Cost of Offshore Wind Energy?
Offshore wind currently accounts for a small amount of the total installed wind power capacity in the world approximately 1%. The development of offshore wind has mainly been in northern European counties, around the North Sea and the Baltic Sea, where about 20 projects have been implemented. At the end of 2008, 1,471 MW of capacity was located offshore (Figure 1).

 Finland, Germany, Ireland, Italy, the Netherlands, Sweden and the UK, as shown in Figure 2. In 2007, the Swedish offshore wind farm, Lillgrunden was installed with a rated capacity of 110 MW. Most of the capacity has been installed in relatively shallow waters (under 20m water depth), no more than 20 km from the coast, in order to minimise the extra costs of foundations and sea cables.
Offshore wind capacity is still around 50% more expensive than onshore wind. However, due to the expected benefits of higher wind speeds and the lower visual impact of the larger turbines, several countries predominantly in European Union Member States have very ambitious goals concerning offshore wind.
The total capacity is still limited, but growth rates are high. Offshore wind farms are usually made up of many turbines often 100-200. Currently, higher costs and temporary capacity restrictions in manufacturing, as well as in the availability of installation vessels cause some delays. Even so, several projects will be developed within the coming years, as seen from the tables below.
INVESTMENT COST OF OFFSHORE WIND ENERGY
Offshore costs depend largely on weather and wave conditions, water depth and distance from the coast. The most detailed cost information on recent offshore installations comes from the UK, where 90 MW were added in 2006 and 100 MW in 2007; and from Sweden with the installation of Lillgrunden in 2007. The information on some of the recently established offshore wind farms. As shown, the chosen turbine size for offshore wind farms ranges from 2 to 3.6 MW, with the newer wind farms being equipped with the larger turbines. The size of the wind farms also varies substantially, from the fairly small Samsø wind farm of 23 MW, to Robin Rigg with a rated capacity of 180 MW, the world’s largest offshore wind farm. Investment costs per MW range from a low of 1.2 million €/MW (Middelgrunden) to 2.7 million €/MW (Robin Rigg) see Figure 3.
The higher offshore capital costs are due to the larger structures and complex logistics of installing the towers. The costs of offshore foundations, construction, installations and grid connection are significantly higher than for onshore. For example, offshore turbines are generally 20% more expensive and towers and foundations cost more than 2.5 times the price of a similar onshore project.
In general, the costs of offshore capacity have increased up to mid 2008, as is also the case for onshore turbines, and these increases are only partly reflected in the costs shown in Figure 3. As a result, the costs of future offshore farms may be different. On average, investment costs for a new offshore wind farm are in the range of 2.0 to 2.2 million €/MW for a near-shore, shallow water facility.

In Denmark, all of the cost components above are covered by the investors, except for the costs of the transformer station and the main transmission cable to the coast, which are covered by transmission system operators (TSOs) in the respective areas. Similar legislation has recently been passed in Germany for offshore wind farms. The total costs of each of the two offshore farms are around €260 million.
The main differences in the cost structure between onshore and offshore turbines are linked to two issues:
OFFSHORE WIND ELECTRICITY GENERATION COST
Although the investment costs are considerable higher for offshore than for onshore wind farms, they are partly offset by a higher total electricity production from the turbines, due to higher offshore wind speeds. For an onshore installation utilisation, the time is normally around 2,000-2,500 full load hours per year, while for a typical offshore installation this figure reaches up to 4,000 full load hours per year, depending on the site.
In addition, the following economic assumptions are made:

Costs are calculated on a simple national economic basis, and are not those of a private investor. Private investors have higher financial costs and require a risk premium and, obviously, a profit. So the amount a private investor would add on top of the simple costs would depend, to a large extent, on the perceived technological and political risks of establishing the offshore farm and on the competition between manufacturers and developers. That is why the production cost of wind energy for onshore and offshore, calculated above, does not give an indication about the levels of national feed in tariffs or premiums, for example, as no investor would accept zero profits. This chapter looks exclusively at cost whereas Chapter 2 addresses prices that is, the amount of money paid to investors, which relates to the development of national financial frameworks and payment mechanisms. In Appendix II there is a case study on the price of offshore wind energy in Denmark. In Appendix III there is a case study of offshore wind power development in Denmark.
COST OF FUTURE OFFSHORE WIND ENERGY
Until 2004, the cost of onshore wind turbines generally followed the development of a medium term cost reduction curve (learning curve), showing a learning rate of approximately 10% namely, that each time wind power capacity doubled, the cost went down by approximately 10% per MW installed. This decreasing cost trend changed in 2004-2006, when the price of wind power in general increased by approximately 20-25%. This was caused mainly by the increasing costs of raw materials and a strong demand for wind capacity, which implied larger order books at manufacturers and scarcity of wind power manufacturing capacity and sub supplier capacity for manufacturing turbine components.
A similar price increase can be observed for offshore wind power, although a fairly small number of finished projects, as well as a large spread in investment costs, make it difficult to identify the price level for offshore turbines accurately. On average, the expected investment costs for a new offshore wind farm are currently in the range of 2.0 to 2.2 million €/MW.
In the following section, the medium term cost development of offshore wind power is estimated using the learning curve methodology. However, it should be noted that there is considerable uncertainty over the use of learning curves, even for the medium term, and results should be used with caution.
The medium term cost predictions for offshore wind power are shown in the following conditions:
The average cost of offshore wind capacity is expected to decrease from 2.1 million €/MW in 2006 to 1.81 million €/MW in 2015, or by approximately 15%. There will still be a considerable spread of costs, from 1.55 million €/MW to 2.06 million €/MW. A capacity factor of constant 37.5% (corresponding to a number of full load hours of approximately 3,300) is expected for the whole period. This covers increased production from newer and larger turbines, moderated by sites with lower wind regimes, and a greater distance to shore, which increases losses in transmission of power, unless new High Voltage DC grid technology is applied.
FIGURE 1: Total offshore wind power installed by end 2008, EWEA
Nine countries have operating offshore wind farms: Belgium, Denmark,
Offshore wind capacity is still around 50% more expensive than onshore wind. However, due to the expected benefits of higher wind speeds and the lower visual impact of the larger turbines, several countries predominantly in European Union Member States have very ambitious goals concerning offshore wind.
The total capacity is still limited, but growth rates are high. Offshore wind farms are usually made up of many turbines often 100-200. Currently, higher costs and temporary capacity restrictions in manufacturing, as well as in the availability of installation vessels cause some delays. Even so, several projects will be developed within the coming years, as seen from the tables below.
FIGURE 2: Development of offshore wind power in the EU 1998-2008, EWEA
Offshore costs depend largely on weather and wave conditions, water depth and distance from the coast. The most detailed cost information on recent offshore installations comes from the UK, where 90 MW were added in 2006 and 100 MW in 2007; and from Sweden with the installation of Lillgrunden in 2007. The information on some of the recently established offshore wind farms. As shown, the chosen turbine size for offshore wind farms ranges from 2 to 3.6 MW, with the newer wind farms being equipped with the larger turbines. The size of the wind farms also varies substantially, from the fairly small Samsø wind farm of 23 MW, to Robin Rigg with a rated capacity of 180 MW, the world’s largest offshore wind farm. Investment costs per MW range from a low of 1.2 million €/MW (Middelgrunden) to 2.7 million €/MW (Robin Rigg) see Figure 3.
The higher offshore capital costs are due to the larger structures and complex logistics of installing the towers. The costs of offshore foundations, construction, installations and grid connection are significantly higher than for onshore. For example, offshore turbines are generally 20% more expensive and towers and foundations cost more than 2.5 times the price of a similar onshore project.
In general, the costs of offshore capacity have increased up to mid 2008, as is also the case for onshore turbines, and these increases are only partly reflected in the costs shown in Figure 3. As a result, the costs of future offshore farms may be different. On average, investment costs for a new offshore wind farm are in the range of 2.0 to 2.2 million €/MW for a near-shore, shallow water facility.
FIGURE 3: Investments in offshore wind farms, million €/MW (current prices)
To illustrate the economics of offshore wind turbines in more detail, the two largest Danish offshore wind farms can be taken as examples. The Horns Rev project, located approximately 15 km off the west coast of Jutland (west of Esbjerg), was finished in 2002. It is equipped with 80 machines of 2 MW, and has a total capacity of 160 MW. The Nysted offshore wind farm is located south of the island of Lolland. It consists of 72 turbines of 2.3 MW and has a total capacity of 165 MW. Both wind farms have their own on site transformer stations, which are connected to the high voltage grid at the coast through transmission cables. The farms are operated from onshore control stations, so staff are not required at the sites.In Denmark, all of the cost components above are covered by the investors, except for the costs of the transformer station and the main transmission cable to the coast, which are covered by transmission system operators (TSOs) in the respective areas. Similar legislation has recently been passed in Germany for offshore wind farms. The total costs of each of the two offshore farms are around €260 million.
The main differences in the cost structure between onshore and offshore turbines are linked to two issues:
- Foundations are considerably more expensive for offshore turbines. The costs depend on both the sea depth and the type of foundation being built (at Horns Rev monopiles were used, while the turbines at Nysted are erected on concrete gravity foundations). For a conventional turbine situated on land, the foundations’ share of the total cost is normally around 5-9%. As an average of the two projects mentioned above, this percentage is 21%, and thus considerably more expensive than for onshore sites. However, since considerable experience will be gained through these two wind farms, a further optimisation of foundations can be expected in future projects.
- Transformer stations and sea transmission cables increase costs. Connections between turbines and the centrally located transformer station, and from there to the coast, generate additional costs. For Horns Rev and Nysted wind farms, the average cost share for the transformer station and sea transmission cables is 21%, of which a small proportion (5%) goes on the internal grid between turbines.
OFFSHORE WIND ELECTRICITY GENERATION COST
Although the investment costs are considerable higher for offshore than for onshore wind farms, they are partly offset by a higher total electricity production from the turbines, due to higher offshore wind speeds. For an onshore installation utilisation, the time is normally around 2,000-2,500 full load hours per year, while for a typical offshore installation this figure reaches up to 4,000 full load hours per year, depending on the site.
In addition, the following economic assumptions are made:
- Over the lifetime of the wind farm, annual operation and maintenance costs are assumed to be 16 €/MWh, except for Middelgrunden where these costs based on existing accounts are assumed to be 12 €/MWh for the entire lifetime.
- The number of full load hours is given for a normal wind year and corrected for wake effects within the farm, as well as unavailability and losses in transmission to the coast.
- In some countries, wind farm owners are responsible for balancing the power production from the turbines. According to previous Danish experiences, balancing costs are around c€ 0.3/kWh in a system where wind covers over 20% of national electricity demand. However, balancing costs are also uncertain, and depend greatly on the regulatory and institutional frameworks and may differ substantially between countries.
- The economic analyses are carried out on a simple national economic basis, using a discount rate of 7.5% per annum, over the assumed lifetime of 20 years. Taxes, depreciation, profit and risk premiums are not taken into account.
FIGURE 4: Calculated production cost for selected offshore wind farms, including balancing costs(2006-prices)
It can be seen that total production costs differ significantly between the illustrated wind farms, with Horns Rev, Samsø and Nysted being among the cheapest, and Robin Rigg in the UK being the most expensive. Differences can be related partly to the depth of the sea and distance to the shore, and partly to increased investment costs in recent years. O&M costs are assumed to be at the same level for all wind farms (except Middelgrunden) and are subject to considerable uncertainty. Costs are calculated on a simple national economic basis, and are not those of a private investor. Private investors have higher financial costs and require a risk premium and, obviously, a profit. So the amount a private investor would add on top of the simple costs would depend, to a large extent, on the perceived technological and political risks of establishing the offshore farm and on the competition between manufacturers and developers. That is why the production cost of wind energy for onshore and offshore, calculated above, does not give an indication about the levels of national feed in tariffs or premiums, for example, as no investor would accept zero profits. This chapter looks exclusively at cost whereas Chapter 2 addresses prices that is, the amount of money paid to investors, which relates to the development of national financial frameworks and payment mechanisms. In Appendix II there is a case study on the price of offshore wind energy in Denmark. In Appendix III there is a case study of offshore wind power development in Denmark.
COST OF FUTURE OFFSHORE WIND ENERGY
Until 2004, the cost of onshore wind turbines generally followed the development of a medium term cost reduction curve (learning curve), showing a learning rate of approximately 10% namely, that each time wind power capacity doubled, the cost went down by approximately 10% per MW installed. This decreasing cost trend changed in 2004-2006, when the price of wind power in general increased by approximately 20-25%. This was caused mainly by the increasing costs of raw materials and a strong demand for wind capacity, which implied larger order books at manufacturers and scarcity of wind power manufacturing capacity and sub supplier capacity for manufacturing turbine components.
A similar price increase can be observed for offshore wind power, although a fairly small number of finished projects, as well as a large spread in investment costs, make it difficult to identify the price level for offshore turbines accurately. On average, the expected investment costs for a new offshore wind farm are currently in the range of 2.0 to 2.2 million €/MW.
In the following section, the medium term cost development of offshore wind power is estimated using the learning curve methodology. However, it should be noted that there is considerable uncertainty over the use of learning curves, even for the medium term, and results should be used with caution.
The medium term cost predictions for offshore wind power are shown in the following conditions:
- The existing manufacturing capacity constraints for wind turbines will continue until 2010. Although there will be a gradual expansion of industrial capacity for wind power, a prolonged increase in demand could continue to strain the manufacturing capacity. A more balanced demand and supply, resulting in unit reduction costs in the industry, is not expected to occur before 2011.
- The total capacity development of wind power is assumed to be the main driving factor for the cost development of offshore turbines, since most of the turbine costs are related to the general development of the wind industry. Thus, the growth rate of installed capacity is assumed to be a doubling of cumulative installations every three years.
- For the period between 1985 and 2004, a learning rate of approximately 10% was estimated (Neij, 2003). In 2011, this learning rate is again expected to be achieved by the industry up until 2015.
The average cost of offshore wind capacity is expected to decrease from 2.1 million €/MW in 2006 to 1.81 million €/MW in 2015, or by approximately 15%. There will still be a considerable spread of costs, from 1.55 million €/MW to 2.06 million €/MW. A capacity factor of constant 37.5% (corresponding to a number of full load hours of approximately 3,300) is expected for the whole period. This covers increased production from newer and larger turbines, moderated by sites with lower wind regimes, and a greater distance to shore, which increases losses in transmission of power, unless new High Voltage DC grid technology is applied.
Post a Comment:
You may also like:

Featured Articles
What Sounds Do Turbines Make?
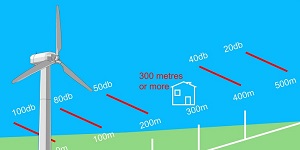 Modern low RPM (Revolutions Per Minute) turbines are very quiet, with sound levels usually below that of typical ambient noise in ...
Modern low RPM (Revolutions Per Minute) turbines are very quiet, with sound levels usually below that of typical ambient noise in ...Does the Sound of Wind Turbines Affect ...
 With respect to wind turbine noise, the one adverse impact that is supported by epidemiological data is an association between ...
With respect to wind turbine noise, the one adverse impact that is supported by epidemiological data is an association between ...Is Wind Energy Practical for Me?
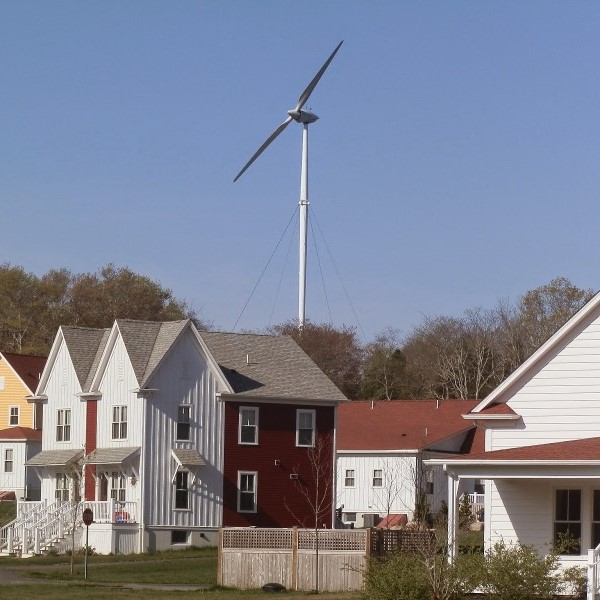 Can I use wind energy to power my home? More people across the country are asking this question as they look for a hedge ...
Can I use wind energy to power my home? More people across the country are asking this question as they look for a hedge ...How do Wind Turbines Work?
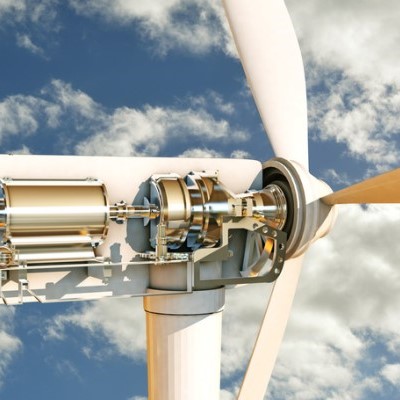 Wind turbines generate electrical power in the same way as all other generation technologies. The only difference is in the ...
Wind turbines generate electrical power in the same way as all other generation technologies. The only difference is in the ...How Much Energy Will Wind Turbine ...
 According to the AWEA Small Wind Turbine Performance and Safety Standard, the Rated Annual Energy of a wind turbine for ...
According to the AWEA Small Wind Turbine Performance and Safety Standard, the Rated Annual Energy of a wind turbine for ...