Home » Wind Energy » What is the Basic Cost of Wind Energy?
What is the Basic Cost of Wind Energy?
One of the most important economic benefits of wind power is that it reduces the exposure of our economies to fuel price volatility. This benefit is so sizable that it could easily justify a larger share of wind energy in most European countries, even if wind were more expensive per kWh than other forms of power generation. This risk reduction from wind energy is presently not accounted for by standard methods for calculating the cost of energy, which have been used by public authorities for more than a century. Quite the contrary, current calculation methods blatantly favour the use of high-risk options for power generation. In a situation where the industrialized world is becoming ever more dependent on importing fuel from politically unstable areas at unpredictable and higher prices, this aspect merits immediate attention.
The markets will not solve these problems by themselves because markets do not properly value the external effects of power generation. Governments need to correct the market failures arising from external effects because costs and benefits for a household or a firm who buys or sells in the market are different from the cost and benefits to society. It is cheaper for power companies to dump their waste, e.g. in the form of fl y ashes, CO2, nitrousoxides, sulphur oxides and methane for free. The problem is that it creates cost for others, e.g. in the form of lung disease, damage from acid rain or global warming. Similarly, the benefits of using wind energy accrue to the economy and society as a whole, and not to individual market participants (the so-called common goods problem).
This report provides a systematic framework for the economic dimension of wind energy and of the energy policy debate when comparing different power generation technologies. A second contribution is to put fuel price risk directly into the analysis of the optimal choice of energy sources for power generation.
Approximately 75% of the total cost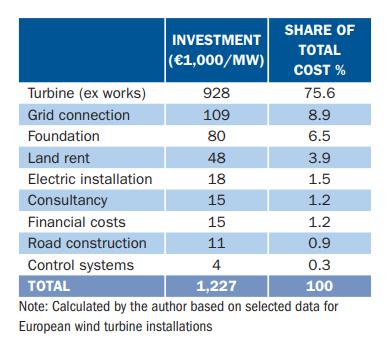 of energy for a wind turbine
The markets will not solve these problems by themselves because markets do not properly value the external effects of power generation. Governments need to correct the market failures arising from external effects because costs and benefits for a household or a firm who buys or sells in the market are different from the cost and benefits to society. It is cheaper for power companies to dump their waste, e.g. in the form of fl y ashes, CO2, nitrousoxides, sulphur oxides and methane for free. The problem is that it creates cost for others, e.g. in the form of lung disease, damage from acid rain or global warming. Similarly, the benefits of using wind energy accrue to the economy and society as a whole, and not to individual market participants (the so-called common goods problem).
This report provides a systematic framework for the economic dimension of wind energy and of the energy policy debate when comparing different power generation technologies. A second contribution is to put fuel price risk directly into the analysis of the optimal choice of energy sources for power generation.
Approximately 75% of the total cost
 of energy for a wind turbine
is related to upfront costs such as the cost of the turbine, foundation, electrical equipment, grid-connection and so on. Obviously, fluctuating fuel costs have no impact on power generation costs. Thus a wind turbine is capital-intensive compared to conventional fossil fuel fired technologies such as a natural gas power plant, where as much as 40-70% of costs are related to fuel and O&M. Table gives the price structure of a typical 2 MW wind turbine. Operation and maintenance (O&M) costs for onshore wind energy are generally estimated to be around 1.2 to 1.5 c€ per kWh of wind power produced over the total lifetime of a turbine. Spanish data indicates that less than 60% of this amount goes strictly to the O&M of the turbine and installations, with the rest equally distributed between labour costs and spare parts. The remaining 40% is split equally between insurance, land rental and overheads.
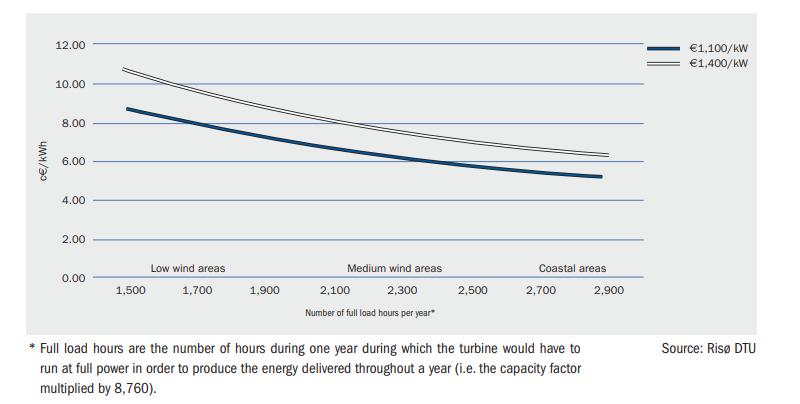
The costs per kWh of wind-generated power, calculated as a function of the wind regime at the chosen sites, are shown in Figure 1 below. As illustrated, the costs range from approximately 7-10 c€/kWh at sites with low average wind speeds, to approximately 5-6.5 c€/kWh at windy coastal sites, with an average of approximately 7c€/kWh at a wind site with average wind speeds. The figure also shows how installation costs change electricity production cost.
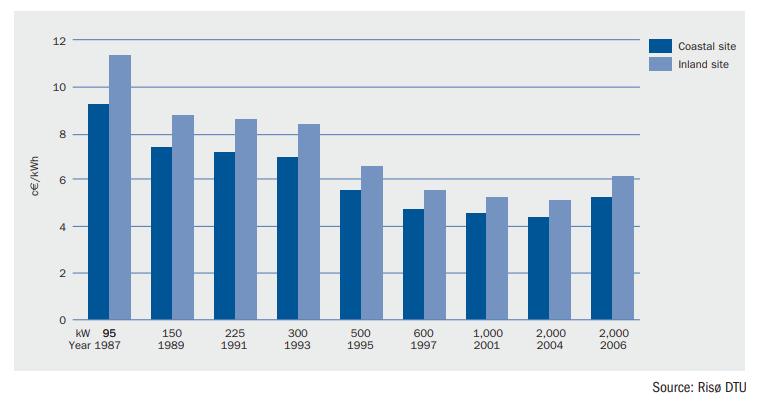
 The rapid European and global development of wind power capacity has had a strong influence on the cost of wind power over the last 20 years. To illustrate the trend towards lower production costs of wind-generated power, a case (Figure 3) that shows the production costs for different sizes and models of turbines is presented. Due to limited data, the trend curve has only been constructed for Denmark, although a similar trend (at a slightly slower pace) was observed in Germany.
The economic consequences of the trend towards larger turbines and improved cost-effectiveness are clear. For a coastal site, for example, the average cost has decreased from around 9.2 c€ /kWh for the 95 kW turbine (mainly installed in the mid 1980s), to around 5.3 c€ /kWh for a fairly new 2,000 kW machine, an improvement of more than 40% (constant €2006 prices).
Using the specific costs of energy as a basis (costs per kWh produced), the estimated progress ratios range from 0.83 to 0.91, corresponding to learning rates of 0.17 to 0.09. That means that when the total installed capacity of wind power doubles, the costs per kWh produced for new turbines goes down by between 9 and 17%. Offshore wind currently accounts for a small amount of the total installed wind power capacity in the world–approximately 1%. The development of offshore wind has mainly been in northern European counties, around the North Sea and the Baltic Sea, where about 20 projects have been implemented. At the end of 2008, 1,471 MW of capacity was located offshore.
Offshore wind capacity is still around 50% more expensive than onshore wind. However, due to the expected benefits of higher wind speeds and the lower visual impact of the larger turbines, several countries–predominantly in European Union Member States - have very ambitious goals concerning offshore wind.
Although the investment costs are considerably higher for offshore than for onshore wind farms, they are partly offset by a higher total electricity production from the turbines, due to higher offshore wind speeds. For an onshore installation utilisation, the energy production indicator is normally around 2,000-2,500 full load hours per year, while for a typical offshore installation this figure reaches up to 4,000 full load hours per year, depending on the site. Figure 4 shows the expected annual wind power investments from 2000 to 2030, based on the European Wind Energy Association’s scenarios up to 2030(1). The market is expected to be stable at around €10 billion/year up to 2015, with a gradually increasing share of investments going to offshore. By 2020, the annual market for wind power capacity will have grown to €17 billion annually with approximately half of investments going to offshore. By 2030, annual wind energy investments in EU-27 will reach almost €20 billion with 60% of investments offshore. It should be noted that the European Wind Energy Association will adjust its scenarios during 2009, to reflect the December 2008 Directive on Renewable Energy, which sets mandatory targets for the share of renewable energy in the 27 EU Member States.
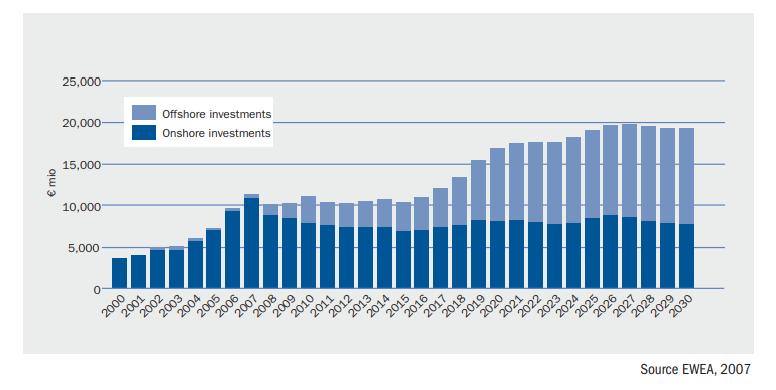
Figure 5 shows the total CO2 costs and fuel costs avoided during the lifetime of the wind energy capacity installed for each of the years 2008-2030, assuming a technical lifetime for onshore wind turbines of 20 years and for offshore wind turbines of 25 years. Furthermore, it is assumed that wind energy avoids an average of 690g CO2/kWh produced; that the average price of a CO2 allowance is €25/t CO2 and that €42 million worth of fuel is avoided for each TWh of wind power produced, equivalent to an oil price throughout the period of $90 per barrel.
COST OF WIND POWER COMPARED TO OTHER TECHNOLOGIES
The general cost of conventional electricity production is determined by four components:
In this report, fuel prices are given by the international markets and, in the reference case, are assumed to develop according to the IEA’s World Energy Outlook 2007, which assumes a crude oil price of $63/barrel in 2007, gradually declining to $59/barrel in 2010 (constant terms). As is normally observed, natural gas prices are assumed to follow the crude oil price (basic assumptions on other fuel prices: Coal €1.6/GJ and natural gas €6.05/GJ). Oil prices reached a high of $147/barrel in July 2008. Note that, in its 2008edition of the World Energy Outlook, the IEA increased its fuel price projections to €100/barrel in 2010 and $122/barrel in 2030 (2007 prices).
Figure 6 shows the results of the reference case, assuming the two conventional power plants are coming online in 2010. Figures for the conventional plants are calculated using the Recabs model and the IEA fuel price assumptions mentioned above ($59/ barrel in 2010), while the costs for wind power are recaptured from the figures for onshore wind power arrived at earlier in this study.
At the time of writing, (September 2008), the crude oil price is $120/barrel, significantly higher than the forecast IEA oil price for 2010. Therefore, a sensitivity analysis is carried through and results are shown in Figure 7.
In Figure 7, the natural gas price is assumed to double compared to the reference equivalent to an oil price of $118/barrel in 2010, the coal price to increase by 50% and the price of CO2 to increase to 35€/t from 25€/t in 2008. As shown in Figure 7, the competitiveness of wind-generated power increases significantly with rising fuel and carbon prices; costs at the inland site become lower than generation costs for the natural gas plant and around 10% more expensive than the coal-fired plant. On coastal sites, wind power produces the cheapest electricity of the three.
The uncertainties mentioned above, related to future fossil fuel prices, imply a considerable risk for future generation costs of conventional plants. The calculations here do not include the macro-economic benefits of fuel price certainty, CO2 price certainty, portfolio effects, merit-order effects and so on.
Even if wind power were more expensive per kWh, it might account for a significant share in the utilities’ portfolio of power plants since it hedges against unexpected rises in prices of fossil fuels and CO2 in the future. According to the International Energy Agency (IEA), a EU carbon price of €10 adds 1c€/kwh to the generating cost of coal and 0.5c€/kWh to the cost of gas generated electricity. Thus, the consistent nature of wind power costs justifies a relatively higher price compared to the uncertain risky future costs of conventional power.
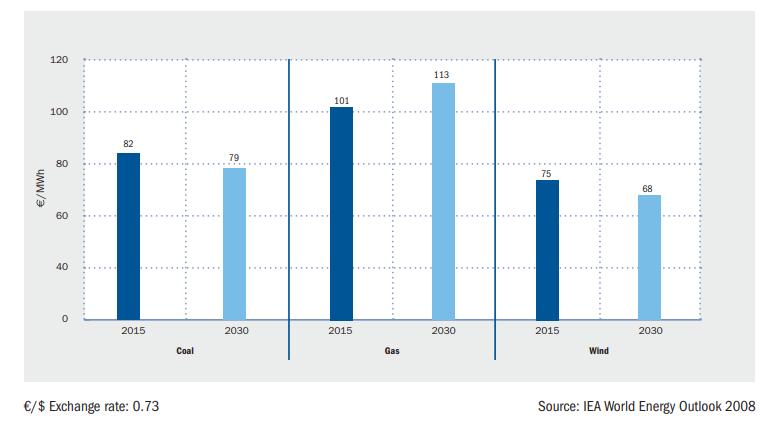
In its 2008 edition of World Energy Outlook, the IEA revised its assumptions on both fuel prices and power plant construction cost. Consequently, it increased its estimates for new-build cost. For the European Union, it also assumed that a carbon price of $30 per tonne of CO2 adds $30/MWh to the generating cost of coal and $15/MWh to the generating cost of gas CCGT plants. Figure 8 shows the IEA’s assumption on future generating cost for new coal, gas and wind energy in the EU in 2015 and 2030. It shows that the IEA expects new wind power capacity to be cheaper than coal and gas in 2015 and 2030.
The costs per kWh of wind-generated power, calculated as a function of the wind regime at the chosen sites, are shown in Figure 1 below. As illustrated, the costs range from approximately 7-10 c€/kWh at sites with low average wind speeds, to approximately 5-6.5 c€/kWh at windy coastal sites, with an average of approximately 7c€/kWh at a wind site with average wind speeds. The figure also shows how installation costs change electricity production cost.
FIGURE 1: Calculated costs per kWh of wind generated power as a function of the wind regime at the chosen site (number of full load hours)

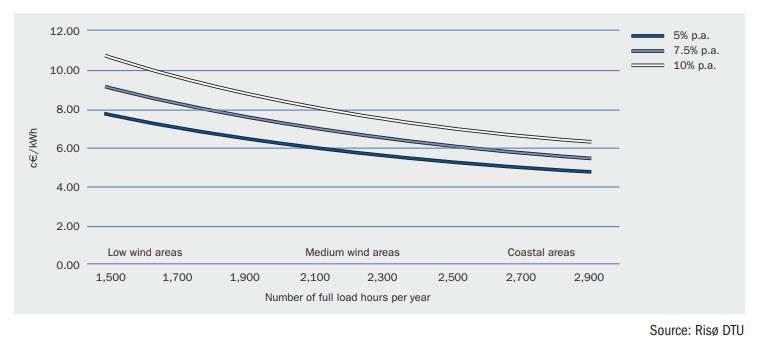
Figure 2 shows how discount rates affect wind power generation costs.

The economic consequences of the trend towards larger turbines and improved cost-effectiveness are clear. For a coastal site, for example, the average cost has decreased from around 9.2 c€ /kWh for the 95 kW turbine (mainly installed in the mid 1980s), to around 5.3 c€ /kWh for a fairly new 2,000 kW machine, an improvement of more than 40% (constant €2006 prices).
FIGURE 3: Total wind energy costs per unit of electricity produced, by turbine size (c€/kWh, constant €2006 prices), and assuming a 7.5% discount rate.

Using the specific costs of energy as a basis (costs per kWh produced), the estimated progress ratios range from 0.83 to 0.91, corresponding to learning rates of 0.17 to 0.09. That means that when the total installed capacity of wind power doubles, the costs per kWh produced for new turbines goes down by between 9 and 17%. Offshore wind currently accounts for a small amount of the total installed wind power capacity in the world–approximately 1%. The development of offshore wind has mainly been in northern European counties, around the North Sea and the Baltic Sea, where about 20 projects have been implemented. At the end of 2008, 1,471 MW of capacity was located offshore.
Offshore wind capacity is still around 50% more expensive than onshore wind. However, due to the expected benefits of higher wind speeds and the lower visual impact of the larger turbines, several countries–predominantly in European Union Member States - have very ambitious goals concerning offshore wind.
Although the investment costs are considerably higher for offshore than for onshore wind farms, they are partly offset by a higher total electricity production from the turbines, due to higher offshore wind speeds. For an onshore installation utilisation, the energy production indicator is normally around 2,000-2,500 full load hours per year, while for a typical offshore installation this figure reaches up to 4,000 full load hours per year, depending on the site. Figure 4 shows the expected annual wind power investments from 2000 to 2030, based on the European Wind Energy Association’s scenarios up to 2030(1). The market is expected to be stable at around €10 billion/year up to 2015, with a gradually increasing share of investments going to offshore. By 2020, the annual market for wind power capacity will have grown to €17 billion annually with approximately half of investments going to offshore. By 2030, annual wind energy investments in EU-27 will reach almost €20 billion with 60% of investments offshore. It should be noted that the European Wind Energy Association will adjust its scenarios during 2009, to reflect the December 2008 Directive on Renewable Energy, which sets mandatory targets for the share of renewable energy in the 27 EU Member States.
FIGURE 4: Wind energy investments 2000-2030 (€ mio)

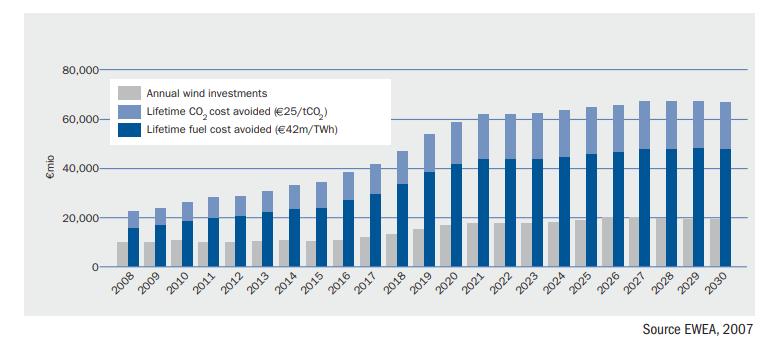
Figure 5 shows the total CO2 costs and fuel costs avoided during the lifetime of the wind energy capacity installed for each of the years 2008-2030, assuming a technical lifetime for onshore wind turbines of 20 years and for offshore wind turbines of 25 years. Furthermore, it is assumed that wind energy avoids an average of 690g CO2/kWh produced; that the average price of a CO2 allowance is €25/t CO2 and that €42 million worth of fuel is avoided for each TWh of wind power produced, equivalent to an oil price throughout the period of $90 per barrel.
FIGURE 5: Wind investments compared with life time avoided fuel and CO2 costs (Oil – $90/barrel; CO2 – €25/t)

COST OF WIND POWER COMPARED TO OTHER TECHNOLOGIES
The general cost of conventional electricity production is determined by four components:
- Fuel cost
- Cost of CO2 emissions (as given by the European Trading System for CO2, the ETS)
- O&M costs
- Capital costs, including planning and site work
In this report, fuel prices are given by the international markets and, in the reference case, are assumed to develop according to the IEA’s World Energy Outlook 2007, which assumes a crude oil price of $63/barrel in 2007, gradually declining to $59/barrel in 2010 (constant terms). As is normally observed, natural gas prices are assumed to follow the crude oil price (basic assumptions on other fuel prices: Coal €1.6/GJ and natural gas €6.05/GJ). Oil prices reached a high of $147/barrel in July 2008. Note that, in its 2008edition of the World Energy Outlook, the IEA increased its fuel price projections to €100/barrel in 2010 and $122/barrel in 2030 (2007 prices).
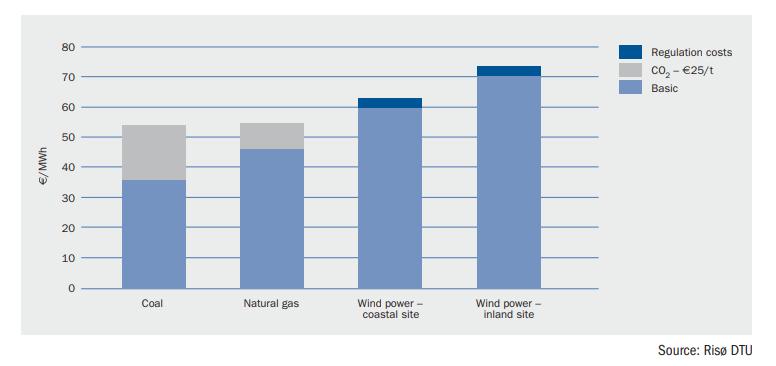
Figure 6 shows the results of the reference case, assuming the two conventional power plants are coming online in 2010. Figures for the conventional plants are calculated using the Recabs model and the IEA fuel price assumptions mentioned above ($59/ barrel in 2010), while the costs for wind power are recaptured from the figures for onshore wind power arrived at earlier in this study.
FIGURE 6: Costs of generated power comparing conventional plants to wind power, year 2010 (constant €2006)

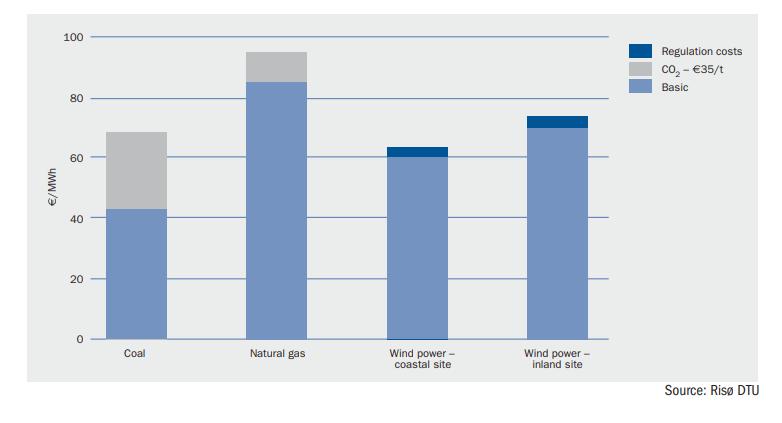
At the time of writing, (September 2008), the crude oil price is $120/barrel, significantly higher than the forecast IEA oil price for 2010. Therefore, a sensitivity analysis is carried through and results are shown in Figure 7.
In Figure 7, the natural gas price is assumed to double compared to the reference equivalent to an oil price of $118/barrel in 2010, the coal price to increase by 50% and the price of CO2 to increase to 35€/t from 25€/t in 2008. As shown in Figure 7, the competitiveness of wind-generated power increases significantly with rising fuel and carbon prices; costs at the inland site become lower than generation costs for the natural gas plant and around 10% more expensive than the coal-fired plant. On coastal sites, wind power produces the cheapest electricity of the three.
FIGURE 7: Sensitivity analysis of costs of generated power comparing conventional plants to wind power,
assuming increasing fossil fuel and CO2 prices, year 2010 (constant €2006)

The uncertainties mentioned above, related to future fossil fuel prices, imply a considerable risk for future generation costs of conventional plants. The calculations here do not include the macro-economic benefits of fuel price certainty, CO2 price certainty, portfolio effects, merit-order effects and so on.
Even if wind power were more expensive per kWh, it might account for a significant share in the utilities’ portfolio of power plants since it hedges against unexpected rises in prices of fossil fuels and CO2 in the future. According to the International Energy Agency (IEA), a EU carbon price of €10 adds 1c€/kwh to the generating cost of coal and 0.5c€/kWh to the cost of gas generated electricity. Thus, the consistent nature of wind power costs justifies a relatively higher price compared to the uncertain risky future costs of conventional power.
FIGURE 8: Electricity generating costs in the European Union, 2015 and 2030

In its 2008 edition of World Energy Outlook, the IEA revised its assumptions on both fuel prices and power plant construction cost. Consequently, it increased its estimates for new-build cost. For the European Union, it also assumed that a carbon price of $30 per tonne of CO2 adds $30/MWh to the generating cost of coal and $15/MWh to the generating cost of gas CCGT plants. Figure 8 shows the IEA’s assumption on future generating cost for new coal, gas and wind energy in the EU in 2015 and 2030. It shows that the IEA expects new wind power capacity to be cheaper than coal and gas in 2015 and 2030.
Post a Comment:
You may also like:
Featured Articles
What Are the Advantages of Wind Energy?
 Wind power is the fastest-growing source of electricity worldwide. The American Wind Energy Association estimates that more ...
 Wind power is the fastest-growing source of electricity worldwide. The American Wind Energy Association estimates that more ...
What is the Wind Energy Conversion ...
 Due to technical and economic visibility, wind power has emerged as one of the most promising renewable energy sources ...
 Due to technical and economic visibility, wind power has emerged as one of the most promising renewable energy sources ...
How Wind Energy is Collected and ...
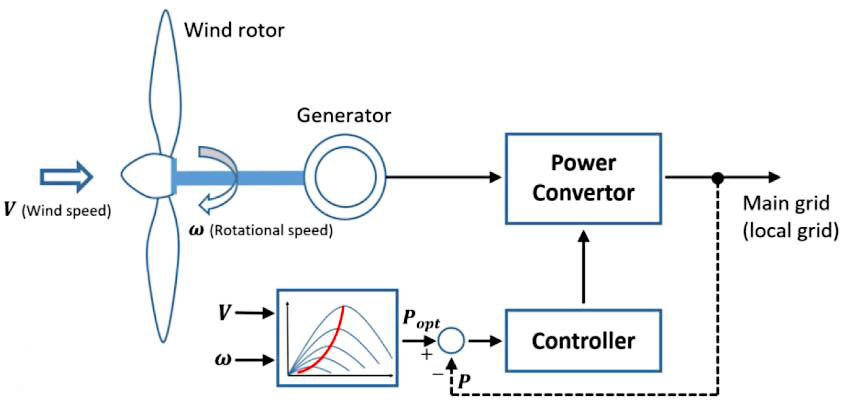 Wind energy is a form of solar energy. Earth’s atmosphere is unevenly heated by solar radiation and the air is in constant motion ...
 Wind energy is a form of solar energy. Earth’s atmosphere is unevenly heated by solar radiation and the air is in constant motion ...
Wind Energy Background
 The kinetic energy in the wind is a promising source of renewable energy with significant potential in many parts of the world. ...
 The kinetic energy in the wind is a promising source of renewable energy with significant potential in many parts of the world. ...
Technical Potential for Wind Energy
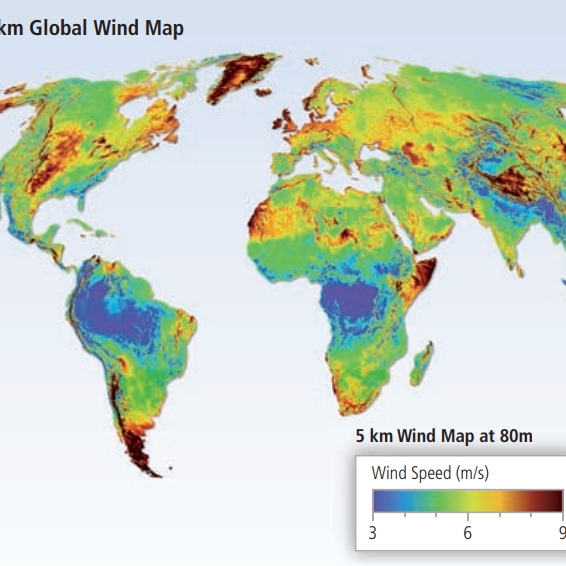 The theoretical potential for wind, as estimated by the global annual flux, has been estimated at 6,000 EJ/yr. The global ...
 The theoretical potential for wind, as estimated by the global annual flux, has been estimated at 6,000 EJ/yr. The global ...