What is the Evolution and Future Outlook of Wind Markets?
The huge expected increase in global onshore wind installed capacity over the coming decades inevitably raises technical questions regarding how and where to accommodate the new wind facilities. Other than the presence of the primary wind source, fundamental aspects to be considered are the availability of land, the need for additional infrastructure and power system flexibility measures, adequate manufacturing facilities and transport needs to allow the development and operation of the new wind farms.
Evolution of the Wind Industry
Rising concerns about climate change, the health effects of air pollution, energy security and energy access, along with volatile oil prices in recent decades, have led to the need to produce and use alternative, low-carbon technology options such as renewables. Wind power has been a pioneering renewable technology in recent decades. In terms of total installed capacity, wind power is the leading renewable energy technology after hydropower, with more than half a terawatt installed globally as of the end of 2018. Along with solar, wind also dominated total renewable capacity additions, with around 43 GW of wind capacity added globally in 2018.
The evolution of the wind industry has been remarkable, and in the last four decades several milestones have been achieved in installations, technology advancements and cost reductions along with the establishment of key wind energy associations (Figure 1). By 2020, onshore wind is set to consistently offer a less expensive source of new electricity than the least-cost fossil fuel alternative in most regions.
Wind power will remain a key renewable energy option in the coming decades. This report sheds light on the prominent role of wind power in transforming the global energy landscape by 2050. The following sections cover an accelerated deployment pathway for wind power (onshore and offshore) until 2050 under the REmap Case in IRENA’s global energy transformation roadmap, along with perspectives on cost reductions, technology trends and the need to prepare future grids to integrate rising wind power shares.

The deployment of renewables has accelerated since 2010, reaching record levels and outpacing annual additions of conventional power capacity in many regions. Among all renewable energy technologies, wind power, after hydropower, has dominated the renewables industry for many decades. At the end of 2018, the global cumulative installed capacity of onshore wind power reached 542 GW. Wind power has increased at an average compound annual growth rate (CAGR) of more than 21% since 2000.
Considering the ample resource availability, large market potential and cost competitiveness, onshore wind is expected to drive overall renewables growth in several regions over the next decade. For the next three decades, onshore wind power installations would need to have a year-on year CAGR of more than 7% (Figure 2). This implies that the total installed capacity of onshore wind would grow more than three-fold by 2030 (to 1 787 GW) and nearly ten-fold by 2050, nearing 5 044 GW, compared to 542 GW in 2018. An average CAGR of more than 7% for the next three decades is well below what has been achieved since 2000, with the historical average CAGR between 2000 and 2018 at around 21%. This shows the feasibility and ease of scaling up onshore wind installations in the next three decades by simply continuing the historical pace. In addition, a global onshore wind installed capacity of 5 044 GW by 2050 represents only a fraction (5.3%) of the global wind resource potential of at least 95 000 GW, as estimated by a technical committee of the World Wind Energy Association (WWEA) in available wind resource studies (WWEA, 2014). The total land area required for global onshore installation of 5 044 GW by 2050 is between 1 008 800 square kilometres (km²) (around the size of Ethiopia) and 1 664 520 km² (around the size of Iran). In terms of total disrupted area, the range would be between 50 440 km² (around the size of Costa Rica) and 83 226 km² (around the size of Azerbaijan) . During the initial years of wind power deployment, Europe was the key enabler for global wind installations. In 2010, the region accounted for 47% of global onshore installations. Since 2010, rapid wind deployment has been observed in other regions, especially China with a CAGR of around 27%. By 2018, China outpaced Europe to become the largest onshore wind market with nearly one-third of the global installed capacity (IRENA, 2019d). The European Union (EU) had a record year in 2018 in terms of financing new wind capacity, with almost 16.7 GW of future wind power projects attaining Final Investment Decision. Almost USD 29.4 billion was invested in new wind farms in 2018, with onshore wind financed at an average of USD 1.54 million per megawatt (MW), and offshore wind at USD 2.57 million per MW.

Asia – mainly China (at more than 2000 GW) and India (at more than 300 GW) – would continue to lead global onshore wind power installations, with the region accounting for more than half (2656 GW) of the total global capacity by 2050 (Figure 3). After Asia, significant onshore wind power deployments would occur in North America (mainly the US, at more than 850 GW), where the installed capacity would grow more than ten-fold from 2018 levels, reaching around 1 150 GW by 2050. Africa would be a key market for rapid onshore wind deployment in the next three decades. Finding a sustainable way to meet growing energy needs is a core development challenge for the continent. Given the rich resource potential of renewable sources including wind, a major shift from reliance on fossil fuel energy sources and rapidly increasing renewable shares in the energy mix is crucial for the continent. As such, prioritising the rapid deployment of onshore wind projects among other renewables projects from now would result in a total installed onshore wind capacity of more than 500 GW by 2050.

Annual onshore wind capacity additions have increased gradually since the beginning of this century, with an initial drop observed in 2010 followed by fluctuating annual capacity additions through the end of 2018. So far, 2015 has been the record year – adding 65 GW of onshore wind capacity to the global power capacity mix – with smaller amounts in subsequent years due mainly to the expiration of a policy support scheme in China (Figure 4).
With continuous technology advancements and cost reductions, along with the right policies and supportive measures in place, the onshore wind market would grow rapidly over the next three decades. The total onshore wind capacity additions would need to be scaled up more than three-fold by 2030 (closer to 150 GW/year) and more than four-fold by 2050 (more than to 200 GW/year). Considering just the net capacity additions (without replacements), a peak would near 180 GW/year in 20 years, which is almost four-fold higher than the onshore wind capacity global additions of 45 GW in 2018. A slight decline in new capacity additions could be observed from 2040, attributed to many reasons including the availability of land, increasing deployment of offshore wind as well as aiding the growth of other renewables technologies (including hybrid projects).
Along with the growth in net wind capacity additions over the next three decades, another key issue is the replacement of wind turbines that are approaching the end of their technical lifetimes, and the repowering of existing projects to extend their operating lifetimes. System-level maintenance and upgrades, including replacing older components with advanced technologies, can help enhance the socio-economic benefits attained from the initial installations. So far, there are no regulatory or political drivers for repowering. Some turbines could last many more years, and only in some markets is it economically attractive to replace them (for example, through the Production Tax Credit in the US (AWEA, 2019; US DOE, 2019)). Repowering also makes it possible to use the most advanced turbines at locations that have the best onshore wind resources (for example, Delabole wind farm in the United Kingdom (UK).
Repowering has started in various countries in recent years. When supported by adequate supportive measures including financial incentives and price signals, and by stable regulatory frameworks along with prioritised projects planning and local acceptance measures (WindEurope, 2017a), repowering could open more opportunities for newer installations, especially in the final two decades to 2050, which is not yet considered in the analysis. As such, the onshore wind annual market by 2050 would still be two-to three-fold larger than the current market in terms of new installations, and more than four-fold larger with replacements of existing capacities. Accounting for new capacity additions as well as replacements, the total annual additions would stabilise at an average of 200 GW/year in the last decade to 2050.

Replacement and Repowering of Onshore Wind Assets
Replacement of wind assets generally refers to the replacement of wind turbine system components at the end-of-life period with the latest operating and cost-effective technology components. This results in improved energy yield, especially at the best resource sites, as many of the projects that are now 10–15 years old were located in some of the best resource sites. Many of the existing projects with great wind resources also suffer from smaller interconnections to the grid due to the smaller turbines installed earlier compared to the latest turbines available in the market. Getting the complete value of the repowering would also require a fast track for expanding the project grid interconnections so the full benefit of larger turbines can be realised and would result in better integration of variable wind energy into power grids along with their contribution to grid services. In addition, repowering of wind projects instead of decommissioning could aid in improving social acceptance by local communities that are already accustomed to the wind farms and could potentially benefit from additional revenues and local job creations.
Repowering could signify either replacing entire wind turbine system components (full repowering) or upgrading older turbines or specific components (rotor, gearbox) with advanced and efficiency technologies while still retaining existing components such as the foundation and tower (partial repowering). Replacing foundations involves complexities and is expensive, and thus requires in-depth design review to assess the ability of foundations to withstand additional service years (30 to 40 years instead of 20 years). In some cases, repowering of wind assets is done well before the end of the technical lifetime of wind plants, due to economic gains and resource utilisation purposes at the older, best resource sites with improved technology designs potential.
The US Production Tax Credit (PTC), along with improvements in turbine technology, are aiding the growth of partial wind farm repowering activity in the country, which is expected to accelerate further in the coming years. More than 1.3 GW of onshore wind capacity was partially repowered in 2018. At present, the PTC is only a temporary economic tool that drives repowering in the US, and its expiration could slow the repowering effort, impacting the overall onshore wind market. A quarter of North America’s wind turbine fleet is expected to reach the end of its life span by 2030, and repowering of this fleet starting now is important to utilise the rising wind power potential.
In 2016, nearly 12% of the region’s installed wind turbine capacity crossed the 15-year lifetime, and this share will increase to 28% by 2020 (Ziegler et al., 2018). Repowering the EU wind fleet that will reach the end of its lifetime by 2020 or later is crucial for achieving or even exceeding the EU’s renewables target by 2030. The key markets in Europe for repowering are the UK, Germany, Denmark, Spain, Italy, Portugal and France, where the total repowering volume is expected to grow from 1–2 GW in 2017 to 5.5–8.5 GW by 2027 (WindEurope, 2017a). In the UK, repowering of the Delabole wind farm (initially commissioned in 1991) between 2009 and 2011 led to a more than two-fold increase in the plant’s installed capacity, from 4 MW to 9.2 MW. Repowering a further 60 onshore wind farms in the country over the next five years – replacing turbines of less than 1 MW with contemporary turbines (2–3 MW) or upcoming models (4 MW) would result in a net capacity increase of more than 1.3 GW (Energy & Climate, 2018).
Evolution of the Wind Industry
Rising concerns about climate change, the health effects of air pollution, energy security and energy access, along with volatile oil prices in recent decades, have led to the need to produce and use alternative, low-carbon technology options such as renewables. Wind power has been a pioneering renewable technology in recent decades. In terms of total installed capacity, wind power is the leading renewable energy technology after hydropower, with more than half a terawatt installed globally as of the end of 2018. Along with solar, wind also dominated total renewable capacity additions, with around 43 GW of wind capacity added globally in 2018.
The evolution of the wind industry has been remarkable, and in the last four decades several milestones have been achieved in installations, technology advancements and cost reductions along with the establishment of key wind energy associations (Figure 1). By 2020, onshore wind is set to consistently offer a less expensive source of new electricity than the least-cost fossil fuel alternative in most regions.
Wind power will remain a key renewable energy option in the coming decades. This report sheds light on the prominent role of wind power in transforming the global energy landscape by 2050. The following sections cover an accelerated deployment pathway for wind power (onshore and offshore) until 2050 under the REmap Case in IRENA’s global energy transformation roadmap, along with perspectives on cost reductions, technology trends and the need to prepare future grids to integrate rising wind power shares.
Figure 1: Overview of key milestones achieved by the wind industry since 1982.
Accelerated Uptake And Emerging MarketsThe deployment of renewables has accelerated since 2010, reaching record levels and outpacing annual additions of conventional power capacity in many regions. Among all renewable energy technologies, wind power, after hydropower, has dominated the renewables industry for many decades. At the end of 2018, the global cumulative installed capacity of onshore wind power reached 542 GW. Wind power has increased at an average compound annual growth rate (CAGR) of more than 21% since 2000.
Considering the ample resource availability, large market potential and cost competitiveness, onshore wind is expected to drive overall renewables growth in several regions over the next decade. For the next three decades, onshore wind power installations would need to have a year-on year CAGR of more than 7% (Figure 2). This implies that the total installed capacity of onshore wind would grow more than three-fold by 2030 (to 1 787 GW) and nearly ten-fold by 2050, nearing 5 044 GW, compared to 542 GW in 2018. An average CAGR of more than 7% for the next three decades is well below what has been achieved since 2000, with the historical average CAGR between 2000 and 2018 at around 21%. This shows the feasibility and ease of scaling up onshore wind installations in the next three decades by simply continuing the historical pace. In addition, a global onshore wind installed capacity of 5 044 GW by 2050 represents only a fraction (5.3%) of the global wind resource potential of at least 95 000 GW, as estimated by a technical committee of the World Wind Energy Association (WWEA) in available wind resource studies (WWEA, 2014). The total land area required for global onshore installation of 5 044 GW by 2050 is between 1 008 800 square kilometres (km²) (around the size of Ethiopia) and 1 664 520 km² (around the size of Iran). In terms of total disrupted area, the range would be between 50 440 km² (around the size of Costa Rica) and 83 226 km² (around the size of Azerbaijan) . During the initial years of wind power deployment, Europe was the key enabler for global wind installations. In 2010, the region accounted for 47% of global onshore installations. Since 2010, rapid wind deployment has been observed in other regions, especially China with a CAGR of around 27%. By 2018, China outpaced Europe to become the largest onshore wind market with nearly one-third of the global installed capacity (IRENA, 2019d). The European Union (EU) had a record year in 2018 in terms of financing new wind capacity, with almost 16.7 GW of future wind power projects attaining Final Investment Decision. Almost USD 29.4 billion was invested in new wind farms in 2018, with onshore wind financed at an average of USD 1.54 million per megawatt (MW), and offshore wind at USD 2.57 million per MW.
Figure 2: Onshore wind cumulative installed capacity would grow more than three-fold by 2030 and nearly ten-fold by 2050 relative to 2018 levels.
Asia – mainly China (at more than 2000 GW) and India (at more than 300 GW) – would continue to lead global onshore wind power installations, with the region accounting for more than half (2656 GW) of the total global capacity by 2050 (Figure 3). After Asia, significant onshore wind power deployments would occur in North America (mainly the US, at more than 850 GW), where the installed capacity would grow more than ten-fold from 2018 levels, reaching around 1 150 GW by 2050. Africa would be a key market for rapid onshore wind deployment in the next three decades. Finding a sustainable way to meet growing energy needs is a core development challenge for the continent. Given the rich resource potential of renewable sources including wind, a major shift from reliance on fossil fuel energy sources and rapidly increasing renewable shares in the energy mix is crucial for the continent. As such, prioritising the rapid deployment of onshore wind projects among other renewables projects from now would result in a total installed onshore wind capacity of more than 500 GW by 2050.
Figure 3: Asia would continue to dominate global onshore wind power installations by 2050, followed by North America and Europe.
Annual onshore wind capacity additions have increased gradually since the beginning of this century, with an initial drop observed in 2010 followed by fluctuating annual capacity additions through the end of 2018. So far, 2015 has been the record year – adding 65 GW of onshore wind capacity to the global power capacity mix – with smaller amounts in subsequent years due mainly to the expiration of a policy support scheme in China (Figure 4).
With continuous technology advancements and cost reductions, along with the right policies and supportive measures in place, the onshore wind market would grow rapidly over the next three decades. The total onshore wind capacity additions would need to be scaled up more than three-fold by 2030 (closer to 150 GW/year) and more than four-fold by 2050 (more than to 200 GW/year). Considering just the net capacity additions (without replacements), a peak would near 180 GW/year in 20 years, which is almost four-fold higher than the onshore wind capacity global additions of 45 GW in 2018. A slight decline in new capacity additions could be observed from 2040, attributed to many reasons including the availability of land, increasing deployment of offshore wind as well as aiding the growth of other renewables technologies (including hybrid projects).
Along with the growth in net wind capacity additions over the next three decades, another key issue is the replacement of wind turbines that are approaching the end of their technical lifetimes, and the repowering of existing projects to extend their operating lifetimes. System-level maintenance and upgrades, including replacing older components with advanced technologies, can help enhance the socio-economic benefits attained from the initial installations. So far, there are no regulatory or political drivers for repowering. Some turbines could last many more years, and only in some markets is it economically attractive to replace them (for example, through the Production Tax Credit in the US (AWEA, 2019; US DOE, 2019)). Repowering also makes it possible to use the most advanced turbines at locations that have the best onshore wind resources (for example, Delabole wind farm in the United Kingdom (UK).
Repowering has started in various countries in recent years. When supported by adequate supportive measures including financial incentives and price signals, and by stable regulatory frameworks along with prioritised projects planning and local acceptance measures (WindEurope, 2017a), repowering could open more opportunities for newer installations, especially in the final two decades to 2050, which is not yet considered in the analysis. As such, the onshore wind annual market by 2050 would still be two-to three-fold larger than the current market in terms of new installations, and more than four-fold larger with replacements of existing capacities. Accounting for new capacity additions as well as replacements, the total annual additions would stabilise at an average of 200 GW/year in the last decade to 2050.
Figure 4: Global onshore wind power additions would need to grow more than three-fold by 2030 and more than five-fold by 2050 relative to 2018 levels.
Replacement and Repowering of Onshore Wind Assets
Replacement of wind assets generally refers to the replacement of wind turbine system components at the end-of-life period with the latest operating and cost-effective technology components. This results in improved energy yield, especially at the best resource sites, as many of the projects that are now 10–15 years old were located in some of the best resource sites. Many of the existing projects with great wind resources also suffer from smaller interconnections to the grid due to the smaller turbines installed earlier compared to the latest turbines available in the market. Getting the complete value of the repowering would also require a fast track for expanding the project grid interconnections so the full benefit of larger turbines can be realised and would result in better integration of variable wind energy into power grids along with their contribution to grid services. In addition, repowering of wind projects instead of decommissioning could aid in improving social acceptance by local communities that are already accustomed to the wind farms and could potentially benefit from additional revenues and local job creations.
Repowering could signify either replacing entire wind turbine system components (full repowering) or upgrading older turbines or specific components (rotor, gearbox) with advanced and efficiency technologies while still retaining existing components such as the foundation and tower (partial repowering). Replacing foundations involves complexities and is expensive, and thus requires in-depth design review to assess the ability of foundations to withstand additional service years (30 to 40 years instead of 20 years). In some cases, repowering of wind assets is done well before the end of the technical lifetime of wind plants, due to economic gains and resource utilisation purposes at the older, best resource sites with improved technology designs potential.
The US Production Tax Credit (PTC), along with improvements in turbine technology, are aiding the growth of partial wind farm repowering activity in the country, which is expected to accelerate further in the coming years. More than 1.3 GW of onshore wind capacity was partially repowered in 2018. At present, the PTC is only a temporary economic tool that drives repowering in the US, and its expiration could slow the repowering effort, impacting the overall onshore wind market. A quarter of North America’s wind turbine fleet is expected to reach the end of its life span by 2030, and repowering of this fleet starting now is important to utilise the rising wind power potential.
In 2016, nearly 12% of the region’s installed wind turbine capacity crossed the 15-year lifetime, and this share will increase to 28% by 2020 (Ziegler et al., 2018). Repowering the EU wind fleet that will reach the end of its lifetime by 2020 or later is crucial for achieving or even exceeding the EU’s renewables target by 2030. The key markets in Europe for repowering are the UK, Germany, Denmark, Spain, Italy, Portugal and France, where the total repowering volume is expected to grow from 1–2 GW in 2017 to 5.5–8.5 GW by 2027 (WindEurope, 2017a). In the UK, repowering of the Delabole wind farm (initially commissioned in 1991) between 2009 and 2011 led to a more than two-fold increase in the plant’s installed capacity, from 4 MW to 9.2 MW. Repowering a further 60 onshore wind farms in the country over the next five years – replacing turbines of less than 1 MW with contemporary turbines (2–3 MW) or upcoming models (4 MW) would result in a net capacity increase of more than 1.3 GW (Energy & Climate, 2018).
Post a Comment:
You may also like:

Featured Articles
How Much Energy Will Wind Turbine ...
 According to the AWEA Small Wind Turbine Performance and Safety Standard, the Rated Annual Energy of a wind turbine for ...
According to the AWEA Small Wind Turbine Performance and Safety Standard, the Rated Annual Energy of a wind turbine for ...How do Wind Turbines Work?
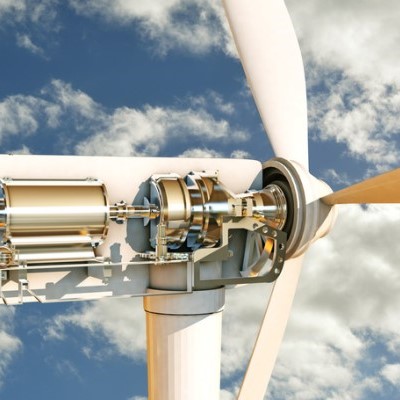 Wind turbines generate electrical power in the same way as all other generation technologies. The only difference is in the ...
Wind turbines generate electrical power in the same way as all other generation technologies. The only difference is in the ...What Sounds Do Turbines Make?
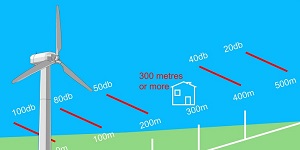 Modern low RPM (Revolutions Per Minute) turbines are very quiet, with sound levels usually below that of typical ambient noise in ...
Modern low RPM (Revolutions Per Minute) turbines are very quiet, with sound levels usually below that of typical ambient noise in ...Does the Sound of Wind Turbines Affect ...
 With respect to wind turbine noise, the one adverse impact that is supported by epidemiological data is an association between ...
With respect to wind turbine noise, the one adverse impact that is supported by epidemiological data is an association between ...Is Wind Energy Practical for Me?
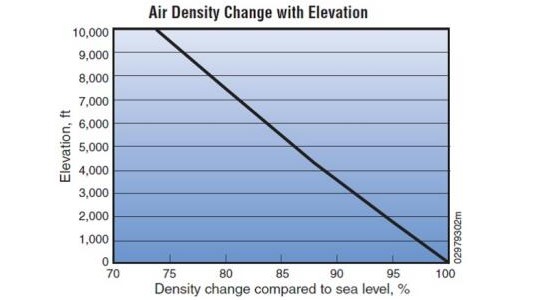
 Can I use wind energy to power my home? More people across the country are asking this question as they look for a hedge ...
Can I use wind energy to power my home? More people across the country are asking this question as they look for a hedge ...