What are Wind Penetration and Spinning Reserves?
If wind generation becomes more popular and replaces some part of the electricity currently supplied by gas and coal, total CO2 emissions due to electricity generation will decrease. In a report for the U.K. Energy Research Council (and partly funded by the Carbon Trust—a U.K. government-funded organization dedicated to promoting reduced emissions of carbon dioxide), Gross et al. estimate that a 1% increase in wind penetration results in a 0.5% reduction of CO2 emissions. If this is correct, moving from 0% penetration to 20% penetration would reduce CO2 emissions by about 10%.
Wind is a variable and intermittent energy source; output varies by wind speed and sometimes it blows too hard or too softly to enable any power to be generated. (To see the effects of attempting to produce electricity from wind when the wind is too strong, conduct a search of the Internet for "exploding wind turbine" and watch the various videos.) In order to meet consumer demand, wind power generation requires backup sources of power, known in the jargon as incremental "spinning reserves" because they must be running continuously, synchronized to the grid, and ready to increase or decrease power on short notice. Typically, natural gas or diesel generators fill this role because they may be ramped up easily—about 1% of total power per minute.
Estimates of the spinning reserves required by wind generation range from 27% to 89% of the total wind power.10 If all of the required spinning reserves were supplied in the form of natural gas turbines, the spinning reserve requirements for wind would be between 165 and 540g CO2 eq/kWh (based on the natural gas numbers in Table).
Reliability, Forecasting and Wind
Demand for electricity can change significantly in a matter of minutes, and if supply does not match demand there will be brown- or blackouts. In order to ensure that supplies match demand, power supply companies rely on detailed forecasts of electricity demands over periods ranging from minutes to hours to days. By being able to anticipate demands accurately, the companies can reliably schedule power plant loadings at minimum cost and maximum reliability.
However, if wind is part of the generation mix, power supply companies must not only forecast demands accurately, but must also include wind forecasts so that if the power supplied by wind turbines suddenly decreases or stops, they can bring backup power on line quickly to maintain system reliability.
But wind is difficult to forecast and its speed and direction can change quickly. This is a problem because we demand extremely high reliability from our electrical system. Hannele Holttinen et al. conclude in their analysis of wind power for the International Energy Agency that "While the total balancing energy needed for the integration of wind power stems from the mean forecast error, the need for reserve power is closely connected to the largest forecast errors, i.e. the tail in the probability density function (pdf) of forecast errors." In other words, as wind penetration increases, system reliability will be adversely affected disproportionately—unless adequate reserve power is made available.
Several power companies have substantial experience in addressing the issues relating to wind forecasts. Take the example of E.ON, a large German power company that in 2004 had approximately 7,000 MW of installed wind power (7,600 turbines) covering a wide geographic area. Figure 1 shows a wind forecast used by E.ON over a two-week period in 2004. The gray line shows the forecasted wind power and the blue line shows the actual wind power over time. Note that for much of the forecast period (tan-colored circles), the wind forecast is actually behind in time as compared to the actual wind. This is because wind speed and direction have large random components, even when averaged over a large geographic area as in this case.

Reserve Requirements and Wind Penetration
As wind penetration increases, power companies will require additional spinning reserves. Figure 2, taken from a wind integration study in New Zealand, shows how spinning reserves (green line) must closely track wind power (blue line). The size of this reserve margin depends on many things, including the power company’s standard procedures for reserve requirements. In the case of incremental wind power, the size of the margin also depends on the wind penetration and the accuracy of the wind forecasts. As wind penetration increases and as forecast error increases, the margin must be a larger fraction of the total grid’s power in order to retain the desired level of grid reliability.


Maintaining high grid reliability is complicated, especially as wind penetration increases. As a concrete example of this, data below describe an actual event that occurred in Germany on Christmas Eve 2004.
Figure 4 shows a summary of the event. E.ON shows wind power in MW over a one-week period. On Christmas Eve, the winds in E.ON's control area quickly died out, dropping wind generation from 6,000 MW down to less than 2,000 MW at a very high rate (16 MW/min). As the E.ON report describes "Whilst wind power feed-in at 9.15 am on Christmas Eve reached its maximum for the year at 6,024MW, it fell to below 2,000MW within only 10 hours, a difference of over 4,000MW. This corresponds to the capacity of 8 x 500MW coal fired power station blocks. On Boxing Day, wind power feed-in in the E.ON grid fell to below 40MW. Handling such significant differences in feed-in levels poses a major challenge to grid operators."

Summarizing, this event was a very large disturbance for E.ON, and had the grid operator not acted quickly, could have led to a widespread power outage in Germany. What does E.ON conclude from the above?
In other words, the more wind power capacity a grid has, the lower the percentage of traditional power generation wind can replace. Figure 5 summarizes this point of view, and as a result of this falling substitution capacity, E.ON intends in future to limit its total wind penetration to less than 4%.

Another way to look at system reliability is from the point of view of "Capacity Credit," which Gross et al. describe as "a measure of the contribution that intermittent generation can make to reliability. It is usually expressed as a percentage of the installed capacity of the intermittent generators." Gross et al. go on to explain that:
There is a range of estimates for capacity credits in the literature and the reasons for there being a range are well understood. The range of findings relevant to British conditions is approximately 20-30% of installed capacity when up to 20% of electricity is sourced from intermittent supplies (usually assumed to be wind power). Capacity credit as a percentage of installed intermittent capacity declines as the share of electricity supplied by intermittent sources increases.

Wind is a variable and intermittent energy source; output varies by wind speed and sometimes it blows too hard or too softly to enable any power to be generated. (To see the effects of attempting to produce electricity from wind when the wind is too strong, conduct a search of the Internet for "exploding wind turbine" and watch the various videos.) In order to meet consumer demand, wind power generation requires backup sources of power, known in the jargon as incremental "spinning reserves" because they must be running continuously, synchronized to the grid, and ready to increase or decrease power on short notice. Typically, natural gas or diesel generators fill this role because they may be ramped up easily—about 1% of total power per minute.
Estimates of the spinning reserves required by wind generation range from 27% to 89% of the total wind power.10 If all of the required spinning reserves were supplied in the form of natural gas turbines, the spinning reserve requirements for wind would be between 165 and 540g CO2 eq/kWh (based on the natural gas numbers in Table).
|
Greenhouse Gas Emissions from Various Sources over the Course of their LifeCycles, in Grams of CO2 eq/kWh |
||||
|
|
Wind | Coal | Nat Gas | Nuclear |
| Fuel Processing | - | 150 | 70 | 11 |
| Equipment manufacture,facility construction | 16.0 | - | - | - |
| Day-to-day operation | - | 900 | 470 | 1 |
| Maintenance | 1.50 | 150 | 70 | - |
| Decommissioning | 1.50 | - | - | - |
| Total | 19.0 | 1200 | 610 | 12 |
Reliability, Forecasting and Wind
Demand for electricity can change significantly in a matter of minutes, and if supply does not match demand there will be brown- or blackouts. In order to ensure that supplies match demand, power supply companies rely on detailed forecasts of electricity demands over periods ranging from minutes to hours to days. By being able to anticipate demands accurately, the companies can reliably schedule power plant loadings at minimum cost and maximum reliability.
However, if wind is part of the generation mix, power supply companies must not only forecast demands accurately, but must also include wind forecasts so that if the power supplied by wind turbines suddenly decreases or stops, they can bring backup power on line quickly to maintain system reliability.
But wind is difficult to forecast and its speed and direction can change quickly. This is a problem because we demand extremely high reliability from our electrical system. Hannele Holttinen et al. conclude in their analysis of wind power for the International Energy Agency that "While the total balancing energy needed for the integration of wind power stems from the mean forecast error, the need for reserve power is closely connected to the largest forecast errors, i.e. the tail in the probability density function (pdf) of forecast errors." In other words, as wind penetration increases, system reliability will be adversely affected disproportionately—unless adequate reserve power is made available.
Several power companies have substantial experience in addressing the issues relating to wind forecasts. Take the example of E.ON, a large German power company that in 2004 had approximately 7,000 MW of installed wind power (7,600 turbines) covering a wide geographic area. Figure 1 shows a wind forecast used by E.ON over a two-week period in 2004. The gray line shows the forecasted wind power and the blue line shows the actual wind power over time. Note that for much of the forecast period (tan-colored circles), the wind forecast is actually behind in time as compared to the actual wind. This is because wind speed and direction have large random components, even when averaged over a large geographic area as in this case.
Figure 1: Wind Forecast Compared with Actual Wind
One consequence of wind’s variability is that it may actually lead to increased emissions as other generators (e.g. coal and gas) in a grid must rapidly respond to wind events. In a report prepared for Independent Petroleum Institute of Mountain States, Bentek Energy reports large increases of SOX and NOX emissions due to the inclusion of wind power into a grid in Colorado.12 Furthermore, Bentek reports that wind’s net impact on CO2 emissions is ambiguous.Reserve Requirements and Wind Penetration
As wind penetration increases, power companies will require additional spinning reserves. Figure 2, taken from a wind integration study in New Zealand, shows how spinning reserves (green line) must closely track wind power (blue line). The size of this reserve margin depends on many things, including the power company’s standard procedures for reserve requirements. In the case of incremental wind power, the size of the margin also depends on the wind penetration and the accuracy of the wind forecasts. As wind penetration increases and as forecast error increases, the margin must be a larger fraction of the total grid’s power in order to retain the desired level of grid reliability.
Figure 2: The Relationship between Spinning Reserve and Wind Power as Illustrated on a Typical
Winter Day on the North Island of New Zealand (periods are 30 minutes)
Figure 3 shows results derived by Holttinen et al.14 As wind penetration increases, reserve requirements also increase. (In the legend, the references to "1 hour" and "4 hours" refer to the time-scale of the wind forecasts, with longer-term forecasts corresponding to more significant variability, because of the greater difficulty of forecasting four hours versus one hour ahead.) Taking the line labeled "Ireland 4 hours" as an example, a wind penetration of 2.5% requires a 7% increase in reserves—based on wind capacity—or a 0.175% increase in reserves—based on grid capacity (0.175% = 2.5% x 0.07). At the high end of the curve a wind penetration of 20% requires an 18.5% increase in reserves—based on wind capacity—or a 3.7% increase in reserves—based on grid capacity (3.7% = 20% x 0.185). Note the high reserve requirements reported for Ireland (especially the "4-hours" line). This is likely because Ireland’s electrical grid is not as interconnected as are other countries'grids, and this lack of interconnection makes it more difficult to provide steady wind power with a more "normal" reserve capacity.Winter Day on the North Island of New Zealand (periods are 30 minutes)
Figure 3: Relationship between the Need for Reserve Generation and Installed Wind Capacity
Gross et al. show that the approximate range of additional reserve requirements is 0.1% of total grid capacity for each percent of wind penetration for wind penetrations below 20%, rising to 0.3% of total grid capacity for each percent of wind penetration above 20%.Maintaining high grid reliability is complicated, especially as wind penetration increases. As a concrete example of this, data below describe an actual event that occurred in Germany on Christmas Eve 2004.
Figure 4 shows a summary of the event. E.ON shows wind power in MW over a one-week period. On Christmas Eve, the winds in E.ON's control area quickly died out, dropping wind generation from 6,000 MW down to less than 2,000 MW at a very high rate (16 MW/min). As the E.ON report describes "Whilst wind power feed-in at 9.15 am on Christmas Eve reached its maximum for the year at 6,024MW, it fell to below 2,000MW within only 10 hours, a difference of over 4,000MW. This corresponds to the capacity of 8 x 500MW coal fired power station blocks. On Boxing Day, wind power feed-in in the E.ON grid fell to below 40MW. Handling such significant differences in feed-in levels poses a major challenge to grid operators."
Figure 4: 2004 Christmas Wind Power Variability, Germany
Summarizing, this event was a very large disturbance for E.ON, and had the grid operator not acted quickly, could have led to a widespread power outage in Germany. What does E.ON conclude from the above?
In other words, the more wind power capacity a grid has, the lower the percentage of traditional power generation wind can replace. Figure 5 summarizes this point of view, and as a result of this falling substitution capacity, E.ON intends in future to limit its total wind penetration to less than 4%.
Figure 5: The Marginal Impact of Increasing Installed Wind Capacity on the Substitutability of Wind
Another way to look at system reliability is from the point of view of "Capacity Credit," which Gross et al. describe as "a measure of the contribution that intermittent generation can make to reliability. It is usually expressed as a percentage of the installed capacity of the intermittent generators." Gross et al. go on to explain that:
There is a range of estimates for capacity credits in the literature and the reasons for there being a range are well understood. The range of findings relevant to British conditions is approximately 20-30% of installed capacity when up to 20% of electricity is sourced from intermittent supplies (usually assumed to be wind power). Capacity credit as a percentage of installed intermittent capacity declines as the share of electricity supplied by intermittent sources increases.
Figure 6: Capacity Credit Decreases with Wind Penetration
Figure 6 from Gross et al. shows that capacity credit decreases as wind penetration increases. This is because at high wind penetrations, additional reserves are required to ensure the same level of grid reliability. Gross et al. show further that the crossover between high and low capacity credit occurs in the neighborhood of 20% wind penetration.Post a Comment:
You may also like:

Featured Articles
What Sounds Do Turbines Make?
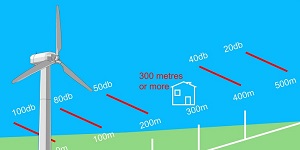 Modern low RPM (Revolutions Per Minute) turbines are very quiet, with sound levels usually below that of typical ambient noise in ...
Modern low RPM (Revolutions Per Minute) turbines are very quiet, with sound levels usually below that of typical ambient noise in ...Does the Sound of Wind Turbines Affect ...
 With respect to wind turbine noise, the one adverse impact that is supported by epidemiological data is an association between ...
With respect to wind turbine noise, the one adverse impact that is supported by epidemiological data is an association between ...Is Wind Energy Practical for Me?
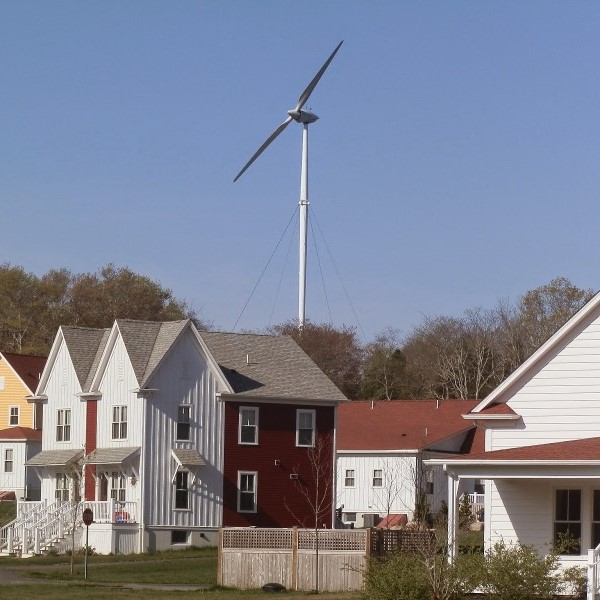 Can I use wind energy to power my home? More people across the country are asking this question as they look for a hedge ...
Can I use wind energy to power my home? More people across the country are asking this question as they look for a hedge ...How Much Energy Will Wind Turbine ...
 According to the AWEA Small Wind Turbine Performance and Safety Standard, the Rated Annual Energy of a wind turbine for ...
According to the AWEA Small Wind Turbine Performance and Safety Standard, the Rated Annual Energy of a wind turbine for ...How do Wind Turbines Work?
 Wind turbines generate electrical power in the same way as all other generation technologies. The only difference is in the ...
Wind turbines generate electrical power in the same way as all other generation technologies. The only difference is in the ...