Home » Application » Wind Energy for Irrigation Application in Nebraska
Wind Energy for Irrigation Application in Nebraska
The majority of irrigation pumping in Nebraska uses fossil fuels such as diesel, nature gas, and propane. An increasing percentage of irrigation pumping is however done by using electrical energy (42% at present). High fuel cost is helping to drive the installed pumping systems to become electric. Wind power as a source for irrigation load becomes attractive due to the large resource of wind available in the state and the decreasing costs of wind energy. This analysis envisions using wind energy to pump water and deliver it to a storage tank connected with pivot-type irrigation system. First goal is to satisfy agriculture needs during irrigation season (spring and summer) and the second goal is to sell back excess electricity to the utility, particularly during the fall and winter months. The electrical power production cost offset and reduce the payback time of the turbine investment.
Wind for Water and Electricity
The diagram of the water pumping system is shown in Fig. 1. The wind turbine(s) (1) is(are) used to produce electrical energy. They are connected to the pump (2) and to the grid (3). During irrigation season most of the energy is used to supply the pumping system while during the winter all the energy is sold to the grid.

Figure 1
There are times when the wind turbine supplies energy to both the pumping system and the electric grid. The pump is used to fill the water storage tank (4) with underground water (5).
Simulation
Wind data from central Nebraska has been used for simulation and analysis. In Fig. 2 is presented hourly data of wind speed in m/s on monthly base. The wind velocity values are monthly averages at 50 m height above the ground.

Fig. 3 represents the irrigation data referred to corn in silt Loam Soil in central Nebraska. Ordinate shows the amount of water required for irrigation (inches) and abscissa shows the time in months. The crop requires most irrigation water during summer time (June, July and August) and needs an average of 11 inches per year of irrigation water.

To determine the optimum solution, different net metering policies have been considered. The electric energy rates purchased from cogenerating and small power producing facilities from three different company LES (Lincoln Electric System), OPPD (Omaha Public Power District) and NPPD (Norris Public Power District) have been evaluated. It was concluded that NPPD provide the most beneficial rate for irrigation purpose. NPPD has different rates for different levels of consumption of energy, the charge for the first level up to 2400 kWh is $0.128/kWh, between 2400 and 7600 kWh it is $0.079/kWh and for all additional kWh it is $0.065/kWh. This work assumes a 1:1 rate (buy/sell).
For the simulation of the wind system three different set up have been used. The first system includes a 30 kW robust start-up turbine. The second system include three 30 kW turbines and the third system include one 100 kW turbine. The grid rate is 115 kV, and a water storage tank 93x103m3.
Simulation Results
Cost summary
The overall system cost includes the wind turbine cost, grid connection cost, all federal and state credits, incentives and financial facilities. For the 30 kW system the overall cost is around hundred thousand dollars, for the three 30 kW system is approximately three hundred thousand dollars and for the 100 kW system is approximately three hundred thousand dollars. All the economic and financial calculations have been based on the available data at December 2008.
In table I is presented the data of the total net present cost in dollars, the levelized cost of energy in dollars per kW/h and operating cost in dollars per year for the three systems. From the simulation results it can be concluded that higher total cost is the 3x30 kW system and the lowest is the 30 kW system while for the operation cost the 100 kW system present the best solution with -13,544 dollars per year and the 30 kW has an operating cost of -1,989 dollars per year. Although the 100 kW system has the highest initial cost but it has the lowest levelized cost of energy. The highest levelized cost of energy was calculated for the 30 kW system but from the economical point of view the best solution is the system using 100 kW wind turbine.
The data of the simulation of the monthly average electric production is presented in Fig. 4. From the simulation results it was deduced that the annual energy productions for the three systems 30, 3x30 and 100 kW was approximately 33, 99 and 111 MWh/yr. For regular operation of the three systems only 100 kW does not need grid support during irrigation season while 30 and 3x30 kW systems need additional 32 and 2.5 MWh/y. The 30 kW system provide only 51% of the required power for irrigation and sell about 13% of the produced energy. The 3x30 system provide almost all the necessary energy for irrigation, covering 98% of the load with turbine production and sell 30% of the energy production. The 100 kW system provide all the energy required for pumping and sell 37% to the grid.

AC Wind Turbine: Fuhrländer 30, 3x30 and 100 kW
The results of the simulation of the electricity production during the year, using the central Nebraska region wind data and the parameters of the turbine, are presented in table II. The mean outputs of 30, 3x30 and 100 kW are 3.77, 11.3 and 12.7 kW correspondingly. The maximum outputs for the three systems were calculated to be 30.8, 92.5 and 117 kW respectively. The operation hours during the year are 3,132 for 30 and 3X30 systems while 3,172 hours for the 100 kW system.
Table II
In Table III is presented the data of the produced and sold energy during the year for the three systems. In Fig. 5 is presented the simulated data of the trend of the volume of the water in the tank during the year. The simulation results for the 3x30 and 100 kW systems coincide with our expectations that during the winter the electricity produced is sold and during the summer is used to pump the water. April will be the first month when the produced electricity from the three systems will not be sold to the grid. In May not all the produced energy of the 100 kW system will be used for irrigation but also will be sold to the grid. Between June and October all the produced electricity of the three systems will be used to supply the pump. The tank of the 30 kW system becomes empty at the beginning of July because the energy supplied from the wind turbine is not enough for replacing the water use for irrigation and by the end of the year the tank is approximately 1/3 full.
Table III

The 30 kW system is not appropriate for usage as it does not produce sufficient energy to fill the whole tank. The 3x30 and 100 kW systems both have similar distribution of volume during the year. Some of the energy of the 100 kW system can be sold after October while the whole energy of the 3x30 kW system is used for pumping the water and can be sold after November. The 100 kW system sells approximately 25% more energy to the grid compared to the 3x30 kW system. The lowest levilized cost and the highest percent of the sell energy makes the 100 kW system an attractive system for irrigation usage.
It is well known that using renewable energy sources leads to reductions in Carbon dioxide emissions and consequently decreased contributions to global warming. Thus a 100 kW system produces clean energy and saves 25.7 ton/year in Carbon dioxide emissions to the atmosphere. Similarly a 3X30 kW and 30 kW system saves 17.8 ton/year and 15.1 ton/year in Carbon dioxide emissions respectively.
For the central Nebraska the 100 kW system has an attractive usage for irrigation due to the lowest levilized cost, the highest percent of the sell energy and the highest reduction of Carbon dioxide emission compared to the 30 and 3x30 kW systems.
Wind for Water and Electricity
The diagram of the water pumping system is shown in Fig. 1. The wind turbine(s) (1) is(are) used to produce electrical energy. They are connected to the pump (2) and to the grid (3). During irrigation season most of the energy is used to supply the pumping system while during the winter all the energy is sold to the grid.
Figure 1
Simulation
Wind data from central Nebraska has been used for simulation and analysis. In Fig. 2 is presented hourly data of wind speed in m/s on monthly base. The wind velocity values are monthly averages at 50 m height above the ground.
Figure 2
Fig. 3 represents the irrigation data referred to corn in silt Loam Soil in central Nebraska. Ordinate shows the amount of water required for irrigation (inches) and abscissa shows the time in months. The crop requires most irrigation water during summer time (June, July and August) and needs an average of 11 inches per year of irrigation water.
Figure 3
To determine the optimum solution, different net metering policies have been considered. The electric energy rates purchased from cogenerating and small power producing facilities from three different company LES (Lincoln Electric System), OPPD (Omaha Public Power District) and NPPD (Norris Public Power District) have been evaluated. It was concluded that NPPD provide the most beneficial rate for irrigation purpose. NPPD has different rates for different levels of consumption of energy, the charge for the first level up to 2400 kWh is $0.128/kWh, between 2400 and 7600 kWh it is $0.079/kWh and for all additional kWh it is $0.065/kWh. This work assumes a 1:1 rate (buy/sell).
For the simulation of the wind system three different set up have been used. The first system includes a 30 kW robust start-up turbine. The second system include three 30 kW turbines and the third system include one 100 kW turbine. The grid rate is 115 kV, and a water storage tank 93x103m3.
Simulation Results
Cost summary
The overall system cost includes the wind turbine cost, grid connection cost, all federal and state credits, incentives and financial facilities. For the 30 kW system the overall cost is around hundred thousand dollars, for the three 30 kW system is approximately three hundred thousand dollars and for the 100 kW system is approximately three hundred thousand dollars. All the economic and financial calculations have been based on the available data at December 2008.
In table I is presented the data of the total net present cost in dollars, the levelized cost of energy in dollars per kW/h and operating cost in dollars per year for the three systems. From the simulation results it can be concluded that higher total cost is the 3x30 kW system and the lowest is the 30 kW system while for the operation cost the 100 kW system present the best solution with -13,544 dollars per year and the 30 kW has an operating cost of -1,989 dollars per year. Although the 100 kW system has the highest initial cost but it has the lowest levelized cost of energy. The highest levelized cost of energy was calculated for the 30 kW system but from the economical point of view the best solution is the system using 100 kW wind turbine.
| Power of the system [kW] | 30 | 3 x 30 | 100 |
| Total net present cost [$] | 70,512 | 117,014 | 80,174 |
| Levelized cost of energy [$/ kWh] | 0.084 | 0.112 | 0.076 |
| Operating cost [$/ yr] | -1,989 | -12,340 | -13,544 |
Table I
The data of the simulation of the monthly average electric production is presented in Fig. 4. From the simulation results it was deduced that the annual energy productions for the three systems 30, 3x30 and 100 kW was approximately 33, 99 and 111 MWh/yr. For regular operation of the three systems only 100 kW does not need grid support during irrigation season while 30 and 3x30 kW systems need additional 32 and 2.5 MWh/y. The 30 kW system provide only 51% of the required power for irrigation and sell about 13% of the produced energy. The 3x30 system provide almost all the necessary energy for irrigation, covering 98% of the load with turbine production and sell 30% of the energy production. The 100 kW system provide all the energy required for pumping and sell 37% to the grid.
Figure 4
AC Wind Turbine: Fuhrländer 30, 3x30 and 100 kW
The results of the simulation of the electricity production during the year, using the central Nebraska region wind data and the parameters of the turbine, are presented in table II. The mean outputs of 30, 3x30 and 100 kW are 3.77, 11.3 and 12.7 kW correspondingly. The maximum outputs for the three systems were calculated to be 30.8, 92.5 and 117 kW respectively. The operation hours during the year are 3,132 for 30 and 3X30 systems while 3,172 hours for the 100 kW system.
| Power of the system [kW] | 30 | 3 x 30 | 100 |
| Total rated capacity [kW] | 30 | 90 | 100 |
| Mean output [kW] | 3.77 | 11.3 | 12.7 |
| Total production [MWh/ yr] | 33 | -99 | 111 |
| Maximum output [kW] | 30.8 | 92.5 | 117 |
| Hours of operation [hr/ yr] | 3,132 | 3,132 | 3,172 |
In Table III is presented the data of the produced and sold energy during the year for the three systems. In Fig. 5 is presented the simulated data of the trend of the volume of the water in the tank during the year. The simulation results for the 3x30 and 100 kW systems coincide with our expectations that during the winter the electricity produced is sold and during the summer is used to pump the water. April will be the first month when the produced electricity from the three systems will not be sold to the grid. In May not all the produced energy of the 100 kW system will be used for irrigation but also will be sold to the grid. Between June and October all the produced electricity of the three systems will be used to supply the pump. The tank of the 30 kW system becomes empty at the beginning of July because the energy supplied from the wind turbine is not enough for replacing the water use for irrigation and by the end of the year the tank is approximately 1/3 full.
|
|
Energy Produced |
Energy Sold |
||||
| Power of the system [kW] | 30 | 30 x 3 | 100 | 30 | 30 x 3 | 100 |
| January | 2569 | 7706 | 8564 | 2569 | 7706 | 8564 |
| February | 2681 | 8043 | 9124 | 2681 | 8043 | 9124 |
| March | 2937 | 8812 | 9911 | 2937 | 8812 | 9911 |
| April | 2853 | 8559 | 9539 | 0 | 0 | 0 |
| May | 3123 | 9368 | 10761 | 0 | 0 | 2385 |
| June | 2554 | 7662 | 8506 | 0 | 0 | 0 |
| July | 2407 | 7220 | 8186 | 0 | 0 | 0 |
| August | 2379 | 7136 | 7961 | 0 | 0 | 0 |
| September | 3078 | 9235 | 10436 | 0 | 0 | 0 |
| October | 2663 | 7989 | 9026 | 0 | 0 | 0 |
| November | 2757 | 8271 | 9326 | 0 | 0 | 677 |
| December | 2986 | 8959 | 10013 | 0 | 6190 | 10013 |
| Total | 33016 | 98959 | 111457 | 8217 | 30751 | 40773 |
Figure 5
The 30 kW system is not appropriate for usage as it does not produce sufficient energy to fill the whole tank. The 3x30 and 100 kW systems both have similar distribution of volume during the year. Some of the energy of the 100 kW system can be sold after October while the whole energy of the 3x30 kW system is used for pumping the water and can be sold after November. The 100 kW system sells approximately 25% more energy to the grid compared to the 3x30 kW system. The lowest levilized cost and the highest percent of the sell energy makes the 100 kW system an attractive system for irrigation usage.
It is well known that using renewable energy sources leads to reductions in Carbon dioxide emissions and consequently decreased contributions to global warming. Thus a 100 kW system produces clean energy and saves 25.7 ton/year in Carbon dioxide emissions to the atmosphere. Similarly a 3X30 kW and 30 kW system saves 17.8 ton/year and 15.1 ton/year in Carbon dioxide emissions respectively.
For the central Nebraska the 100 kW system has an attractive usage for irrigation due to the lowest levilized cost, the highest percent of the sell energy and the highest reduction of Carbon dioxide emission compared to the 30 and 3x30 kW systems.
Post a Comment:
You may also like:

Featured Articles
History of Wind Energy Applications
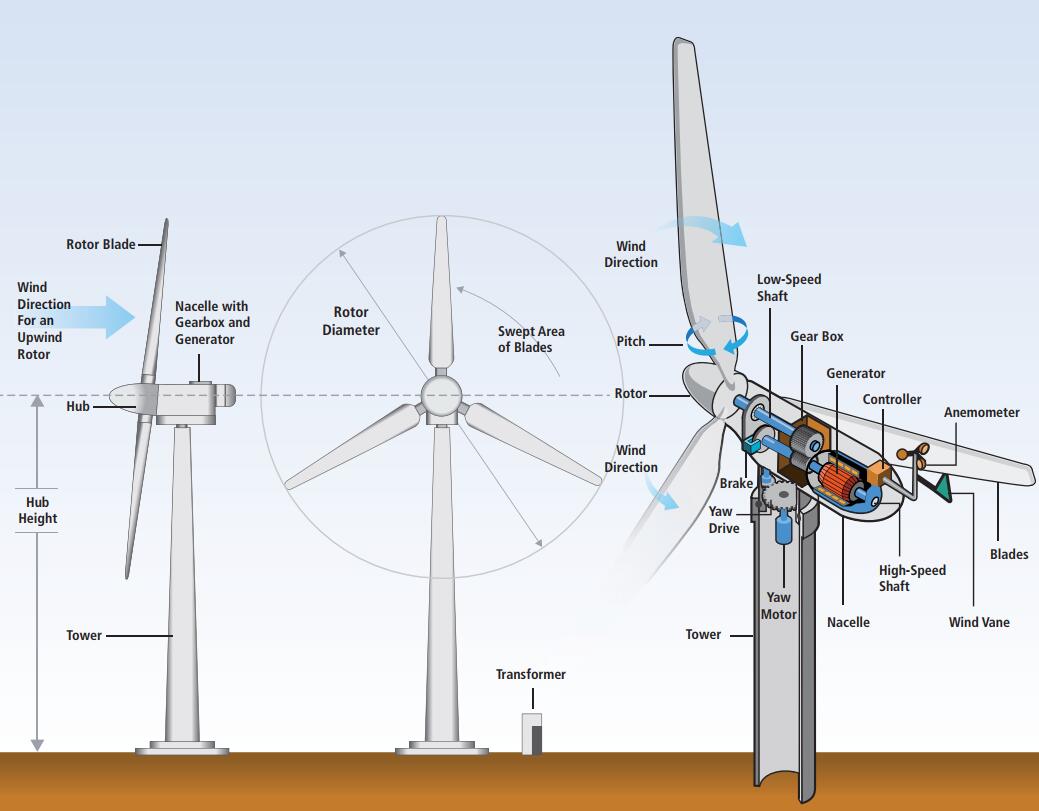
 Wind is used to produce electricity by converting the kinetic energy of air in motion into electricity. In modern wind ...
Wind is used to produce electricity by converting the kinetic energy of air in motion into electricity. In modern wind ...Application in Energy Storage
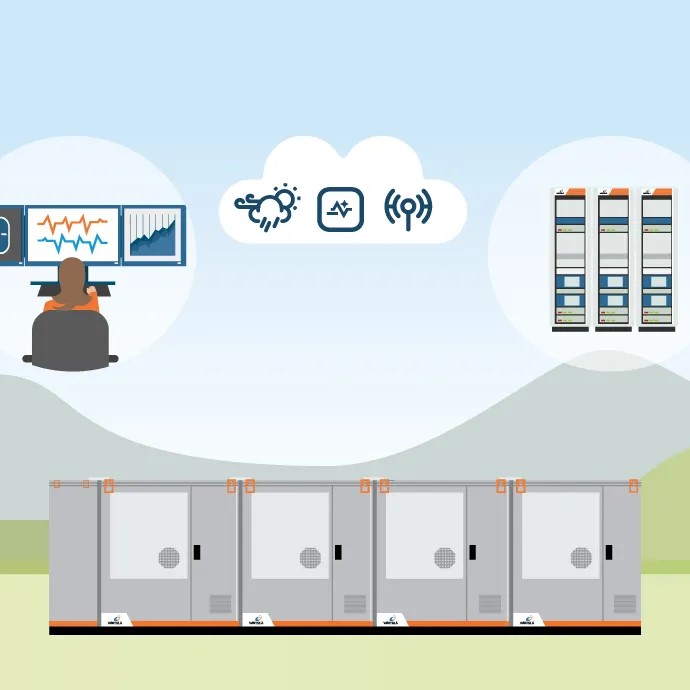 With the development of science and technology, energy storage is one of the most effective ways to solve the problem of ...
With the development of science and technology, energy storage is one of the most effective ways to solve the problem of ...Application in Severe Climates
 Operation in severe climates imposes special design considerations on wind turbines. Severe climates may include those with ...
Operation in severe climates imposes special design considerations on wind turbines. Severe climates may include those with ...Applications for Small Wind Turbines
 Small-scale wind energy is a small but rapidly growing segment of the RE industry in the US. Like other renewable sources, in its ...
Small-scale wind energy is a small but rapidly growing segment of the RE industry in the US. Like other renewable sources, in its ...Wind Turbine for Onshore Application
 Modern, commercial grid-connected wind turbines have evolved from small, simple machines to large,highly ...
Modern, commercial grid-connected wind turbines have evolved from small, simple machines to large,highly ...