What is the Cost of Onshore Wind Energy?
The cost of onshore wind energy can vary depending on factors such as location, turbine size, project scale, and local regulatory conditions. However, in recent years, the cost of onshore wind power has generally decreased due to technological advancements, economies of scale, and increasing market competition.
Below, we present the cost per kWh of onshore wind energy. We will also make a distinction between the unit costs at land and those at the sea, which turn out to be rather different.
The total cost per kWh produced (unit cost) is calculated by discounting and levelising investment and O&M costs over the lifetime of the turbine, and then dividing them by the annual electricity production.
The unit cost of generation is thus calculated as an average cost over the turbine's lifetime. In reality, actual costs will be lower than the calculated average at the beginning of the turbine's life, due to low O&M costs, and will increase over the period of turbine use.
The turbine's power production is the single most important factor for the cost per unit of power generated. The profitability of a turbine depends largely on whether it is sited at a good wind location. In this article, the cost of energy produced by wind power will be calculated according to a number of basic assumptions. Due to the importance of the turbine's power production on its costs, a sensitivity analysis will be applied to this parameter. Other assumptions include the following:

Approximately 75-80% of total power production costs for a wind turbine are related to capital costs–that is the costs of the turbine, foundation, electrical equipment and grid connection. Thus, a wind turbine is capital intensive compared with conventional fossil fuel-fired technologies, such as natural gas power plants, where as much as 40-60% of the total costs are related to fuel and O&M costs. For this reason, the costs of capital (discount or interest rate) are an important factor for the cost of wind generated power; a factor which varies considerably between the EU member countries.
In Figure 2, the costs per kWh of wind-produced power are shown as a function of the wind regime and the discount rate (which varies between 5 and 10% per annum).
As illustrated, the costs ranges between around 6 and 8c€/kWh at medium wind positions, indicating that a doubling of the interest rate induces an increase in production costs of 2 c€/kWh or 33%. In low wind areas, the costs are significantly higher, at around 8-11 c€/kWh, while the production costs range between 5 and 7 c€/kWh in coastal areas for various levels of discount rate.

The rapid European and global development of wind power capacity has had a strong influence on the cost of wind power over the last 20 years. To illustrate the trend towards lower production costs of wind generated power, a case (Figure 1.26) that shows the production costs for different sizes and models of turbines is presented below. Due to limited data, the trend curve has only been constructed for Denmark, although a similar trend (at a slightly slower pace) was observed in Germany.
Figure 3 shows the calculated unit cost for different-sized turbines, based on the same assumptions used previously: a 20-year lifetime is assumed for all turbines in the analysis and a real discount rate of 7.5% per annum is used. All costs are converted into constant €2006 prices. Turbine electricity production is estimated for two wind regimes a coastal and an inland medium wind position.
The starting point for the analysis is the 95 kW machine, which was installed mainly in Denmark during the mid 1980s. This is followed by successively newer turbines (150 kW, 225 kW), ending with the 2,000 kW turbine, which was typically installed from around 2003 onwards. It should be noted that wind turbine manufacturers generally expect the production cost of wind power to decline by 3-5% for each new turbine generation they add to their product portfolio. The calculations are performed for the total lifetime (20 years) of a turbine, which means that calculations for the old turbines are based on track records of more than 15 years (average figures), while newer turbines may have a track record of only a few years; so the newer the turbine, the less accurate the calculations.
The economic consequences of the trend towards larger turbines and improved cost effectiveness are clearly shown in Figure 1.26. For a coastal site, for example, the average cost has decreased from around 9.2 c€ /kWh for the 95 kW turbine (mainly installed in the mid 1980s), to around 5.3 c€ /kWh for a fairly new 2,000 kW machine, an improvement of more than 40% (constant €2006 prices).

In this section, the future development of the economics of wind power is illustrated by the use of the experience curve methodology. The experience curve approach was developed in the 1970s by the Boston Consulting Group, and it relates the cumulative quantitative development of a product to the development of the specific costs (Johnson, 1984).
Thus, if the cumulative sale of a product doubles, the estimated learning rate gives the achieved reduction in specific product costs.
The experience curve is not a forecasting tool based on estimated relationships. It merely shows that if the existing trends continue in the future, the proposed development may be seen. It converts the effect of mass production (economies of scale) into an effect upon production costs without taking other causal relationships into account, such as the cost of raw materials or the demand-supply balance in a particular market (seller’s or buyer’s market). Thus, changes in market development and/or technological breakthroughs within the field may change the picture considerably, as would fluctuations in commodity prices such as those for steel and copper and changes in an industry’s production capacity relative to global demand for the product.
Different experience curves have been estimated for a number of projects. Unfortunately, different specifications and assumptions were used, which means that not all of these projects can be compared directly. To obtain the full value of the experiences gained, the reduction in turbine prices (€/ KW-specification) should be taken into account, as well as improvements in the efficiency of the turbine’s production (which requires the use of an energy specification (€/kWh), as done by Neij in 2003). Thus, using the specific costs of energy as a basis (costs per kWh produced), the estimated progress ratios range from 0.83 to 0.91, corresponding to learning rates of 0.17 to 0.09. That means that when the total installed capacity of wind power doubles, the costs per kWh produced for new turbines goes down by between 9 and 17%. In this way, both the efficiency improvements and embodied and disembodied cost reductions are taken into account in the analysis. Wind power capacity has developed very rapidly in recent years, on average it has increased by 25-30% per year over the last ten years. So, at present the total wind power capacity doubles approximately every three to four years. Figure 4 shows the consequences for wind power production costs, based on the following assumptions:

As an example the power company Hydro-Québec in Canada has made contracts with wind developers to install a total of 1,000 MW of wind power in the period 2006-12 at an average tariff of 4.08 c€/kWh (in 2007 prices indexed with the Canadian CPI) over a 20 year lifetime. Observe that this tariff has to cover not only the costs of investments and O&M, but also the risk premium for the developer (as explained in the next chapter). Thus, the costs of the turbine installation and maintenance should be well below the 4 c€/kWh in fixed 2007 prices(25) at the specific sites in Canada.
The Hydro-Québec deal was signed at a time when wind turbine prices were at their lowest level ever and in a period of excess manufacturing capacity and relatively low commodity prices. As such, the project probably constitutes a historic low in wind farm development prices and, as such, serves as a reference point for future cost reductions.
Below, we present the cost per kWh of onshore wind energy. We will also make a distinction between the unit costs at land and those at the sea, which turn out to be rather different.
The total cost per kWh produced (unit cost) is calculated by discounting and levelising investment and O&M costs over the lifetime of the turbine, and then dividing them by the annual electricity production.
The unit cost of generation is thus calculated as an average cost over the turbine's lifetime. In reality, actual costs will be lower than the calculated average at the beginning of the turbine's life, due to low O&M costs, and will increase over the period of turbine use.
The turbine's power production is the single most important factor for the cost per unit of power generated. The profitability of a turbine depends largely on whether it is sited at a good wind location. In this article, the cost of energy produced by wind power will be calculated according to a number of basic assumptions. Due to the importance of the turbine's power production on its costs, a sensitivity analysis will be applied to this parameter. Other assumptions include the following:
- Calculations relate to new land based, mediumsized turbines (1.5-2 MW) that could be erected today.
- Investment costs reflect the range that is, a cost per kW of 1,100- 1,400 €/kW, with an average of 1,225 €/kW.
- O&M costs are assumed to be 1.45 c€/kWh as an average over the lifetime of the turbine.
- The lifetime of the turbine is set at 20 years, in accordance with most technical design criteria.
- The discount rate is assumed to range from 5 to 10% per annum. In the basic calculations, a discount rate of 7.5% per annum is used, and a sensitivity analysis is also performed.
- Economic analyses are carried out on a simple national economic basis. Taxes, depreciation and risk premiums are not taken into account and all calculations are based on fixed 2006 prices.
FIGURE 1: Calculated costs per kWh of wind generated power as a function of the wind regime at the chosen site (number of full load hours).
In Europe, the best coastal positions are located mainly on the coasts of the UK, Ireland, France, Denmark and Norway. Medium wind areas are mostly found inland in central and southern Europe, Germany, France, Spain, Holland and Italy; and also in northern Europe in Sweden, Finland and Denmark. In many cases, local conditions significantly influence the average wind speeds at a specific site, so significant fluctuations in the wind regime are to be expected even for neighbouring areas.Approximately 75-80% of total power production costs for a wind turbine are related to capital costs–that is the costs of the turbine, foundation, electrical equipment and grid connection. Thus, a wind turbine is capital intensive compared with conventional fossil fuel-fired technologies, such as natural gas power plants, where as much as 40-60% of the total costs are related to fuel and O&M costs. For this reason, the costs of capital (discount or interest rate) are an important factor for the cost of wind generated power; a factor which varies considerably between the EU member countries.
In Figure 2, the costs per kWh of wind-produced power are shown as a function of the wind regime and the discount rate (which varies between 5 and 10% per annum).
As illustrated, the costs ranges between around 6 and 8c€/kWh at medium wind positions, indicating that a doubling of the interest rate induces an increase in production costs of 2 c€/kWh or 33%. In low wind areas, the costs are significantly higher, at around 8-11 c€/kWh, while the production costs range between 5 and 7 c€/kWh in coastal areas for various levels of discount rate.
FIGURE 2: The costs of wind produced power as a function of wind speed (number of full load hours) and discount rate. The installed cost of wind turbines is assumed to be 1,225 €/kW.
HISTORIC COST DEVELOPMENT OF ONSHORE WIND ENERGY OVER TIMEThe rapid European and global development of wind power capacity has had a strong influence on the cost of wind power over the last 20 years. To illustrate the trend towards lower production costs of wind generated power, a case (Figure 1.26) that shows the production costs for different sizes and models of turbines is presented below. Due to limited data, the trend curve has only been constructed for Denmark, although a similar trend (at a slightly slower pace) was observed in Germany.
Figure 3 shows the calculated unit cost for different-sized turbines, based on the same assumptions used previously: a 20-year lifetime is assumed for all turbines in the analysis and a real discount rate of 7.5% per annum is used. All costs are converted into constant €2006 prices. Turbine electricity production is estimated for two wind regimes a coastal and an inland medium wind position.
The starting point for the analysis is the 95 kW machine, which was installed mainly in Denmark during the mid 1980s. This is followed by successively newer turbines (150 kW, 225 kW), ending with the 2,000 kW turbine, which was typically installed from around 2003 onwards. It should be noted that wind turbine manufacturers generally expect the production cost of wind power to decline by 3-5% for each new turbine generation they add to their product portfolio. The calculations are performed for the total lifetime (20 years) of a turbine, which means that calculations for the old turbines are based on track records of more than 15 years (average figures), while newer turbines may have a track record of only a few years; so the newer the turbine, the less accurate the calculations.
The economic consequences of the trend towards larger turbines and improved cost effectiveness are clearly shown in Figure 1.26. For a coastal site, for example, the average cost has decreased from around 9.2 c€ /kWh for the 95 kW turbine (mainly installed in the mid 1980s), to around 5.3 c€ /kWh for a fairly new 2,000 kW machine, an improvement of more than 40% (constant €2006 prices).
FIGURE 3: Total wind energy costs per unit of electricity produced, by turbine size (c€/kWh, constant €2006 prices).
FUTURE COST DEVELOPMENT OF ONSHORE WIND ENERGYIn this section, the future development of the economics of wind power is illustrated by the use of the experience curve methodology. The experience curve approach was developed in the 1970s by the Boston Consulting Group, and it relates the cumulative quantitative development of a product to the development of the specific costs (Johnson, 1984).
Thus, if the cumulative sale of a product doubles, the estimated learning rate gives the achieved reduction in specific product costs.
The experience curve is not a forecasting tool based on estimated relationships. It merely shows that if the existing trends continue in the future, the proposed development may be seen. It converts the effect of mass production (economies of scale) into an effect upon production costs without taking other causal relationships into account, such as the cost of raw materials or the demand-supply balance in a particular market (seller’s or buyer’s market). Thus, changes in market development and/or technological breakthroughs within the field may change the picture considerably, as would fluctuations in commodity prices such as those for steel and copper and changes in an industry’s production capacity relative to global demand for the product.
Different experience curves have been estimated for a number of projects. Unfortunately, different specifications and assumptions were used, which means that not all of these projects can be compared directly. To obtain the full value of the experiences gained, the reduction in turbine prices (€/ KW-specification) should be taken into account, as well as improvements in the efficiency of the turbine’s production (which requires the use of an energy specification (€/kWh), as done by Neij in 2003). Thus, using the specific costs of energy as a basis (costs per kWh produced), the estimated progress ratios range from 0.83 to 0.91, corresponding to learning rates of 0.17 to 0.09. That means that when the total installed capacity of wind power doubles, the costs per kWh produced for new turbines goes down by between 9 and 17%. In this way, both the efficiency improvements and embodied and disembodied cost reductions are taken into account in the analysis. Wind power capacity has developed very rapidly in recent years, on average it has increased by 25-30% per year over the last ten years. So, at present the total wind power capacity doubles approximately every three to four years. Figure 4 shows the consequences for wind power production costs, based on the following assumptions:
FIGURE 4: Using experience curves to illustrate the future development of wind turbine economics until 2015.
The 2006 price-relation is retained until 2010; the reason why no price reductions are foreseen in this period is due to a persistently high demand for new wind turbine capacity, and subsupplier constraints in the delivery of turbine components.- From 2010 until 2015, a learning rate of 10% is assumed, implying that each time the total installed capacity doubles, the costs per kWh of wind generated power decreases by 10%.
- The growth rate of installed capacity is assumed to double cumulative installations every three years.
- The curve illustrates cost development in Denmark, which is a fairly cheap wind power country. Thus, the starting point for the development is a cost of wind power of around 6.1 c€/kWh for an average 2 MW turbine, sited at a medium wind regime area (average wind speed of 6.3 m/s at a hub height of 50 m). The development for a coastal position is also shown.
As an example the power company Hydro-Québec in Canada has made contracts with wind developers to install a total of 1,000 MW of wind power in the period 2006-12 at an average tariff of 4.08 c€/kWh (in 2007 prices indexed with the Canadian CPI) over a 20 year lifetime. Observe that this tariff has to cover not only the costs of investments and O&M, but also the risk premium for the developer (as explained in the next chapter). Thus, the costs of the turbine installation and maintenance should be well below the 4 c€/kWh in fixed 2007 prices(25) at the specific sites in Canada.
The Hydro-Québec deal was signed at a time when wind turbine prices were at their lowest level ever and in a period of excess manufacturing capacity and relatively low commodity prices. As such, the project probably constitutes a historic low in wind farm development prices and, as such, serves as a reference point for future cost reductions.
Post a Comment:
You may also like:

Featured Articles
How Much Energy Will Wind Turbine ...
 According to the AWEA Small Wind Turbine Performance and Safety Standard, the Rated Annual Energy of a wind turbine for ...
According to the AWEA Small Wind Turbine Performance and Safety Standard, the Rated Annual Energy of a wind turbine for ...How do Wind Turbines Work?
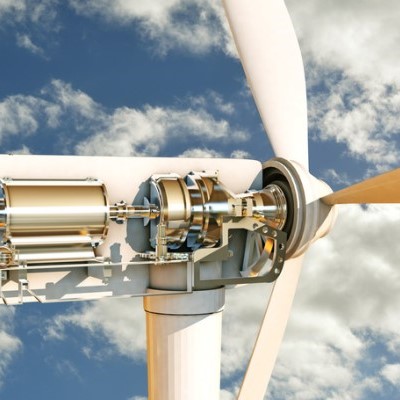 Wind turbines generate electrical power in the same way as all other generation technologies. The only difference is in the ...
Wind turbines generate electrical power in the same way as all other generation technologies. The only difference is in the ...Is Wind Energy Practical for Me?
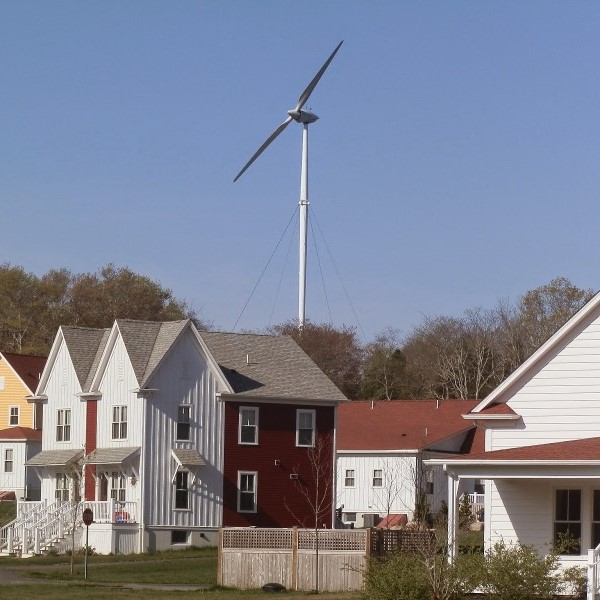 Can I use wind energy to power my home? More people across the country are asking this question as they look for a hedge ...
Can I use wind energy to power my home? More people across the country are asking this question as they look for a hedge ...Does the Sound of Wind Turbines Affect ...
 With respect to wind turbine noise, the one adverse impact that is supported by epidemiological data is an association between ...
With respect to wind turbine noise, the one adverse impact that is supported by epidemiological data is an association between ...What Sounds Do Turbines Make?
 Modern low RPM (Revolutions Per Minute) turbines are very quiet, with sound levels usually below that of typical ambient noise in ...
Modern low RPM (Revolutions Per Minute) turbines are very quiet, with sound levels usually below that of typical ambient noise in ...